Free Statistics
of Irreproducible Research!
Description of Statistical Computation | ||||||||||||||||||||||||||||||
|---|---|---|---|---|---|---|---|---|---|---|---|---|---|---|---|---|---|---|---|---|---|---|---|---|---|---|---|---|---|---|
| Author's title | ||||||||||||||||||||||||||||||
| Author | *The author of this computation has been verified* | |||||||||||||||||||||||||||||
| R Software Module | rwasp_Distributional Plots.wasp | |||||||||||||||||||||||||||||
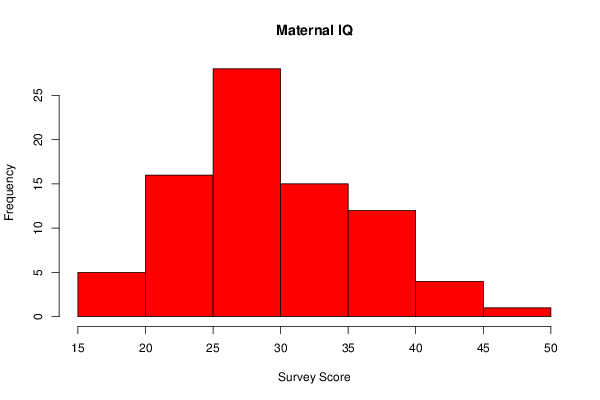
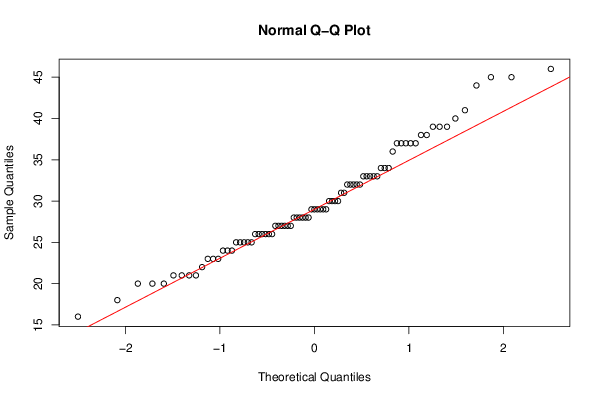
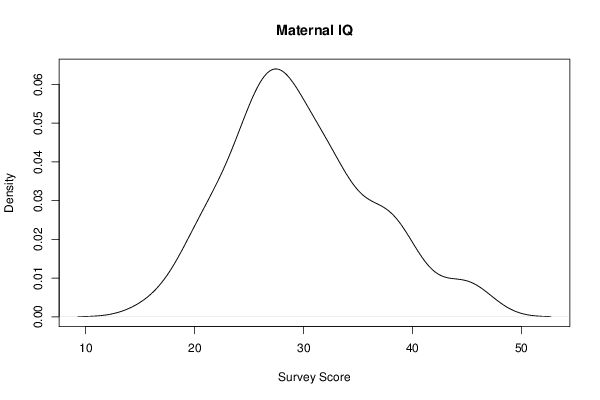
| Title produced by software | Histogram, QQplot and Density | |||||||||||||||||||||||||||||
| Date of computation | Mon, 02 Dec 2013 19:22:17 -0500 | |||||||||||||||||||||||||||||
| Cite this page as follows | Statistical Computations at FreeStatistics.org, Office for Research Development and Education, URL https://freestatistics.org/blog/index.php?v=date/2013/Dec/02/t1386030147c5ss7ni4r7umjzp.htm/, Retrieved Fri, 19 Apr 2024 19:27:56 +0000 | |||||||||||||||||||||||||||||
| Statistical Computations at FreeStatistics.org, Office for Research Development and Education, URL https://freestatistics.org/blog/index.php?pk=230167, Retrieved Fri, 19 Apr 2024 19:27:56 +0000 | ||||||||||||||||||||||||||||||
| QR Codes: | ||||||||||||||||||||||||||||||
|
| ||||||||||||||||||||||||||||||
| Original text written by user: | ||||||||||||||||||||||||||||||
| IsPrivate? | No (this computation is public) | |||||||||||||||||||||||||||||
| User-defined keywords | ||||||||||||||||||||||||||||||
| Estimated Impact | 63 | |||||||||||||||||||||||||||||
Tree of Dependent Computations | ||||||||||||||||||||||||||||||
| Family? (F = Feedback message, R = changed R code, M = changed R Module, P = changed Parameters, D = changed Data) | ||||||||||||||||||||||||||||||
| - [Histogram, QQplot and Density] [Workshop 1 ] [2010-09-29 15:04:17] [98fd0e87c3eb04e0cc2efde01dbafab6] - RM [Histogram, QQplot and Density] [Workshop 1] [2011-10-03 09:04:15] [74be16979710d4c4e7c6647856088456] - R PD [Histogram, QQplot and Density] [IQ] [2013-12-01 23:26:06] [2a0ab6849b64bda85ea7cf9f7a95bdf9] - D [Histogram, QQplot and Density] [Add] [2013-12-02 00:02:22] [2a0ab6849b64bda85ea7cf9f7a95bdf9] - D [Histogram, QQplot and Density] [MumAge] [2013-12-02 00:16:23] [2a0ab6849b64bda85ea7cf9f7a95bdf9] - [Histogram, QQplot and Density] [3] [2013-12-03 00:22:17] [642bf5568726936ba5bd03c4879ab248] [Current] | ||||||||||||||||||||||||||||||
| Feedback Forum | ||||||||||||||||||||||||||||||
Post a new message | ||||||||||||||||||||||||||||||
Dataset | ||||||||||||||||||||||||||||||
| Dataseries X: | ||||||||||||||||||||||||||||||
16 18 20 20 20 21 21 21 21 22 23 23 23 24 24 24 25 25 25 25 25 26 26 26 26 26 26 27 27 27 27 27 27 28 28 28 28 28 28 29 29 29 29 29 29 30 30 30 30 31 31 32 32 32 32 32 33 33 33 33 33 34 34 34 36 37 37 37 37 37 38 38 39 39 39 40 41 44 45 45 46 | ||||||||||||||||||||||||||||||
Tables (Output of Computation) | ||||||||||||||||||||||||||||||
| ||||||||||||||||||||||||||||||
Figures (Output of Computation) | ||||||||||||||||||||||||||||||
Input Parameters & R Code | ||||||||||||||||||||||||||||||
| Parameters (Session): | ||||||||||||||||||||||||||||||
| par1 = 7 ; | ||||||||||||||||||||||||||||||
| Parameters (R input): | ||||||||||||||||||||||||||||||
| par1 = 7 ; | ||||||||||||||||||||||||||||||
| R code (references can be found in the software module): | ||||||||||||||||||||||||||||||
bitmap(file='test1.png') | ||||||||||||||||||||||||||||||