Free Statistics

of Irreproducible Research!

Author's title

Author*Unverified author*
R Software Modulerwasp_smp.wasp
Title produced by softwareStandard Deviation-Mean Plot
Date of computationTue, 03 Dec 2013 14:43:18 -0500
Cite this page as followsStatistical Computations at FreeStatistics.org, Office for Research Development and Education, URL https://freestatistics.org/blog/index.php?v=date/2013/Dec/03/t1386100069cic2nx1vt4t6zva.htm/, Retrieved Thu, 25 Apr 2024 01:01:28 +0000
Statistical Computations at FreeStatistics.org, Office for Research Development and Education, URL https://freestatistics.org/blog/index.php?pk=230398, Retrieved Thu, 25 Apr 2024 01:01:28 +0000
QR Codes:

Original text written by user:
IsPrivate?No (this computation is public)
User-defined keywords
Estimated Impact55
Family? (F = Feedback message, R = changed R code, M = changed R Module, P = changed Parameters, D = changed Data)
-       [Standard Deviation-Mean Plot] [] [2013-12-03 19:43:18] [0f9b748f6fe1dd88ddc67537cf760c5a] [Current]
Feedback Forum

Post a new message
Dataseries X:
9244
7074
7044
6492
6362
8287
18177
10379
11130
9606
7294
7415
9230
7423
6927
7572
5877
8878
16706
9611
12714
10549
8421
9993
12384
9798
11738
9011
7673
10736
18316
10973
14027
10242
8547
8187
11101
8685
9790
8003
7412
9397
17774
11230
13321
9432
7653
7651
10762
8614
8748
7235
7735
8360
16202
11053
13593
9738
8226
7866
11606
9456
8471
7553
8259
9009
13968
12844
14388
12048
9167
7733


Summary of computational transaction
Raw Inputview raw input (R code)
Raw Outputview raw output of R engine
Computing time3 seconds
R Server'Gertrude Mary Cox' @ cox.wessa.net

\begin{tabular}{lllllllll}
\hline
Summary of computational transaction \tabularnewline
Raw Input & view raw input (R code)  \tabularnewline
Raw Output & view raw output of R engine  \tabularnewline
Computing time & 3 seconds \tabularnewline
R Server & 'Gertrude Mary Cox' @ cox.wessa.net \tabularnewline
\hline
\end{tabular}
%Source: https://freestatistics.org/blog/index.php?pk=230398&T=0

[TABLE]
[ROW][C]Summary of computational transaction[/C][/ROW]
[ROW][C]Raw Input[/C][C]view raw input (R code) [/C][/ROW]
[ROW][C]Raw Output[/C][C]view raw output of R engine [/C][/ROW]
[ROW][C]Computing time[/C][C]3 seconds[/C][/ROW]
[ROW][C]R Server[/C][C]'Gertrude Mary Cox' @ cox.wessa.net[/C][/ROW]
[/TABLE]
Source: https://freestatistics.org/blog/index.php?pk=230398&T=0

Globally Unique Identifier (entire table): ba.freestatistics.org/blog/index.php?pk=230398&T=0

As an alternative you can also use a QR Code:  

The GUIDs for individual cells are displayed in the table below:

Summary of computational transaction
Raw Inputview raw input (R code)
Raw Outputview raw output of R engine
Computing time3 seconds
R Server'Gertrude Mary Cox' @ cox.wessa.net


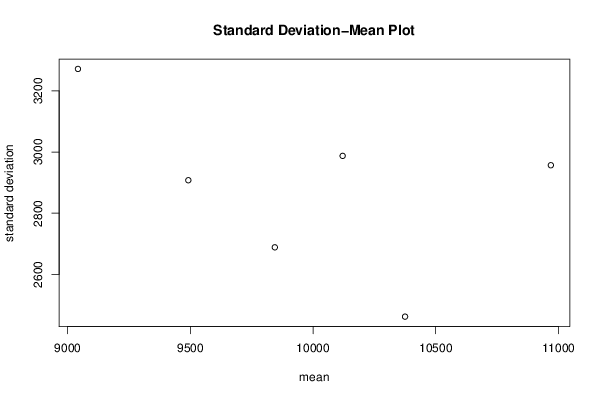
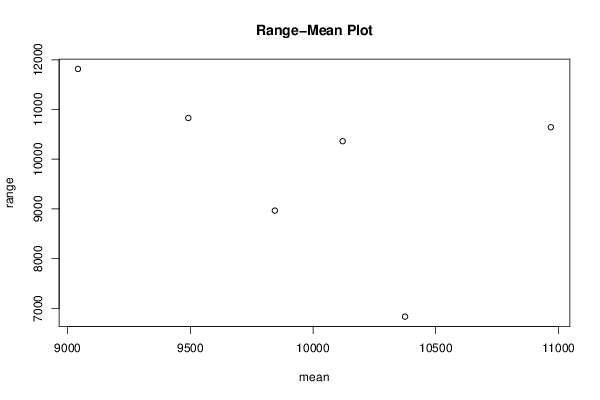
Standard Deviation-Mean Plot
SectionMeanStandard DeviationRange
190423272.1555864320111815
29491.752907.8699209683910829
310969.33333333332956.9705115304410643
410120.752987.6377450177210362
59844.333333333332688.296971329738967
610375.16666666672461.344231155496835

\begin{tabular}{lllllllll}
\hline
Standard Deviation-Mean Plot \tabularnewline
Section & Mean & Standard Deviation & Range \tabularnewline
1 & 9042 & 3272.15558643201 & 11815 \tabularnewline
2 & 9491.75 & 2907.86992096839 & 10829 \tabularnewline
3 & 10969.3333333333 & 2956.97051153044 & 10643 \tabularnewline
4 & 10120.75 & 2987.63774501772 & 10362 \tabularnewline
5 & 9844.33333333333 & 2688.29697132973 & 8967 \tabularnewline
6 & 10375.1666666667 & 2461.34423115549 & 6835 \tabularnewline
\hline
\end{tabular}
%Source: https://freestatistics.org/blog/index.php?pk=230398&T=1

[TABLE]
[ROW][C]Standard Deviation-Mean Plot[/C][/ROW]
[ROW][C]Section[/C][C]Mean[/C][C]Standard Deviation[/C][C]Range[/C][/ROW]
[ROW][C]1[/C][C]9042[/C][C]3272.15558643201[/C][C]11815[/C][/ROW]
[ROW][C]2[/C][C]9491.75[/C][C]2907.86992096839[/C][C]10829[/C][/ROW]
[ROW][C]3[/C][C]10969.3333333333[/C][C]2956.97051153044[/C][C]10643[/C][/ROW]
[ROW][C]4[/C][C]10120.75[/C][C]2987.63774501772[/C][C]10362[/C][/ROW]
[ROW][C]5[/C][C]9844.33333333333[/C][C]2688.29697132973[/C][C]8967[/C][/ROW]
[ROW][C]6[/C][C]10375.1666666667[/C][C]2461.34423115549[/C][C]6835[/C][/ROW]
[/TABLE]
Source: https://freestatistics.org/blog/index.php?pk=230398&T=1

Globally Unique Identifier (entire table): ba.freestatistics.org/blog/index.php?pk=230398&T=1

As an alternative you can also use a QR Code:  

The GUIDs for individual cells are displayed in the table below:

Standard Deviation-Mean Plot
SectionMeanStandard DeviationRange
190423272.1555864320111815
29491.752907.8699209683910829
310969.33333333332956.9705115304410643
410120.752987.6377450177210362
59844.333333333332688.296971329738967
610375.16666666672461.344231155496835


Regression: S.E.(k) = alpha + beta * Mean(k)
alpha4749.25138503349
beta-0.187510165606313
S.D.0.181988988626601
T-STAT-1.03033797276076
p-value0.361072864210975

\begin{tabular}{lllllllll}
\hline
Regression: S.E.(k) = alpha + beta * Mean(k) \tabularnewline
alpha & 4749.25138503349 \tabularnewline
beta & -0.187510165606313 \tabularnewline
S.D. & 0.181988988626601 \tabularnewline
T-STAT & -1.03033797276076 \tabularnewline
p-value & 0.361072864210975 \tabularnewline
\hline
\end{tabular}
%Source: https://freestatistics.org/blog/index.php?pk=230398&T=2

[TABLE]
[ROW][C]Regression: S.E.(k) = alpha + beta * Mean(k)[/C][/ROW]
[ROW][C]alpha[/C][C]4749.25138503349[/C][/ROW]
[ROW][C]beta[/C][C]-0.187510165606313[/C][/ROW]
[ROW][C]S.D.[/C][C]0.181988988626601[/C][/ROW]
[ROW][C]T-STAT[/C][C]-1.03033797276076[/C][/ROW]
[ROW][C]p-value[/C][C]0.361072864210975[/C][/ROW]
[/TABLE]
Source: https://freestatistics.org/blog/index.php?pk=230398&T=2

Globally Unique Identifier (entire table): ba.freestatistics.org/blog/index.php?pk=230398&T=2

As an alternative you can also use a QR Code:  

The GUIDs for individual cells are displayed in the table below:

Regression: S.E.(k) = alpha + beta * Mean(k)
alpha4749.25138503349
beta-0.187510165606313
S.D.0.181988988626601
T-STAT-1.03033797276076
p-value0.361072864210975


Regression: ln S.E.(k) = alpha + beta * ln Mean(k)
alpha14.0724512467253
beta-0.663839052898864
S.D.0.638548029737145
T-STAT-1.03960708041356
p-value0.357231549603798
Lambda1.66383905289886

\begin{tabular}{lllllllll}
\hline
Regression: ln S.E.(k) = alpha + beta * ln Mean(k) \tabularnewline
alpha & 14.0724512467253 \tabularnewline
beta & -0.663839052898864 \tabularnewline
S.D. & 0.638548029737145 \tabularnewline
T-STAT & -1.03960708041356 \tabularnewline
p-value & 0.357231549603798 \tabularnewline
Lambda & 1.66383905289886 \tabularnewline
\hline
\end{tabular}
%Source: https://freestatistics.org/blog/index.php?pk=230398&T=3

[TABLE]
[ROW][C]Regression: ln S.E.(k) = alpha + beta * ln Mean(k)[/C][/ROW]
[ROW][C]alpha[/C][C]14.0724512467253[/C][/ROW]
[ROW][C]beta[/C][C]-0.663839052898864[/C][/ROW]
[ROW][C]S.D.[/C][C]0.638548029737145[/C][/ROW]
[ROW][C]T-STAT[/C][C]-1.03960708041356[/C][/ROW]
[ROW][C]p-value[/C][C]0.357231549603798[/C][/ROW]
[ROW][C]Lambda[/C][C]1.66383905289886[/C][/ROW]
[/TABLE]
Source: https://freestatistics.org/blog/index.php?pk=230398&T=3

Globally Unique Identifier (entire table): ba.freestatistics.org/blog/index.php?pk=230398&T=3

As an alternative you can also use a QR Code:  

The GUIDs for individual cells are displayed in the table below:

Regression: ln S.E.(k) = alpha + beta * ln Mean(k)
alpha14.0724512467253
beta-0.663839052898864
S.D.0.638548029737145
T-STAT-1.03960708041356
p-value0.357231549603798
Lambda1.66383905289886


Parameters (Session):
par1 = 12 ;
Parameters (R input):
par1 = 12 ;
R code (references can be found in the software module):
par1 <- as.numeric(par1)
(n <- length(x))
(np <- floor(n / par1))
arr <- array(NA,dim=c(par1,np))
j <- 0
k <- 1
for (i in 1:(np*par1))
{
j = j + 1
arr[j,k] <- x[i]
if (j == par1) {
j = 0
k=k+1
}
}
arr
arr.mean <- array(NA,dim=np)
arr.sd <- array(NA,dim=np)
arr.range <- array(NA,dim=np)
for (j in 1:np)
{
arr.mean[j] <- mean(arr[,j],na.rm=TRUE)
arr.sd[j] <- sd(arr[,j],na.rm=TRUE)
arr.range[j] <- max(arr[,j],na.rm=TRUE) - min(arr[,j],na.rm=TRUE)
}
arr.mean
arr.sd
arr.range
(lm1 <- lm(arr.sd~arr.mean))
(lnlm1 <- lm(log(arr.sd)~log(arr.mean)))
(lm2 <- lm(arr.range~arr.mean))
bitmap(file='test1.png')
plot(arr.mean,arr.sd,main='Standard Deviation-Mean Plot',xlab='mean',ylab='standard deviation')
dev.off()
bitmap(file='test2.png')
plot(arr.mean,arr.range,main='Range-Mean Plot',xlab='mean',ylab='range')
dev.off()
load(file='createtable')
a<-table.start()
a<-table.row.start(a)
a<-table.element(a,'Standard Deviation-Mean Plot',4,TRUE)
a<-table.row.end(a)
a<-table.row.start(a)
a<-table.element(a,'Section',header=TRUE)
a<-table.element(a,'Mean',header=TRUE)
a<-table.element(a,'Standard Deviation',header=TRUE)
a<-table.element(a,'Range',header=TRUE)
a<-table.row.end(a)
for (j in 1:np) {
a<-table.row.start(a)
a<-table.element(a,j,header=TRUE)
a<-table.element(a,arr.mean[j])
a<-table.element(a,arr.sd[j] )
a<-table.element(a,arr.range[j] )
a<-table.row.end(a)
}
a<-table.end(a)
table.save(a,file='mytable.tab')
a<-table.start()
a<-table.row.start(a)
a<-table.element(a,'Regression: S.E.(k) = alpha + beta * Mean(k)',2,TRUE)
a<-table.row.end(a)
a<-table.row.start(a)
a<-table.element(a,'alpha',header=TRUE)
a<-table.element(a,lm1$coefficients[[1]])
a<-table.row.end(a)
a<-table.row.start(a)
a<-table.element(a,'beta',header=TRUE)
a<-table.element(a,lm1$coefficients[[2]])
a<-table.row.end(a)
a<-table.row.start(a)
a<-table.element(a,'S.D.',header=TRUE)
a<-table.element(a,summary(lm1)$coefficients[2,2])
a<-table.row.end(a)
a<-table.row.start(a)
a<-table.element(a,'T-STAT',header=TRUE)
a<-table.element(a,summary(lm1)$coefficients[2,3])
a<-table.row.end(a)
a<-table.row.start(a)
a<-table.element(a,'p-value',header=TRUE)
a<-table.element(a,summary(lm1)$coefficients[2,4])
a<-table.row.end(a)
a<-table.end(a)
table.save(a,file='mytable1.tab')
a<-table.start()
a<-table.row.start(a)
a<-table.element(a,'Regression: ln S.E.(k) = alpha + beta * ln Mean(k)',2,TRUE)
a<-table.row.end(a)
a<-table.row.start(a)
a<-table.element(a,'alpha',header=TRUE)
a<-table.element(a,lnlm1$coefficients[[1]])
a<-table.row.end(a)
a<-table.row.start(a)
a<-table.element(a,'beta',header=TRUE)
a<-table.element(a,lnlm1$coefficients[[2]])
a<-table.row.end(a)
a<-table.row.start(a)
a<-table.element(a,'S.D.',header=TRUE)
a<-table.element(a,summary(lnlm1)$coefficients[2,2])
a<-table.row.end(a)
a<-table.row.start(a)
a<-table.element(a,'T-STAT',header=TRUE)
a<-table.element(a,summary(lnlm1)$coefficients[2,3])
a<-table.row.end(a)
a<-table.row.start(a)
a<-table.element(a,'p-value',header=TRUE)
a<-table.element(a,summary(lnlm1)$coefficients[2,4])
a<-table.row.end(a)
a<-table.row.start(a)
a<-table.element(a,'Lambda',header=TRUE)
a<-table.element(a,1-lnlm1$coefficients[[2]])
a<-table.row.end(a)
a<-table.end(a)
table.save(a,file='mytable2.tab')