Free Statistics

of Irreproducible Research!

Author's title

Author*The author of this computation has been verified*
R Software Modulerwasp_autocorrelation.wasp
Title produced by software(Partial) Autocorrelation Function
Date of computationWed, 04 Dec 2013 13:34:25 -0500
Cite this page as followsStatistical Computations at FreeStatistics.org, Office for Research Development and Education, URL https://freestatistics.org/blog/index.php?v=date/2013/Dec/04/t1386182156m7benoc9hyl23z5.htm/, Retrieved Sat, 20 Apr 2024 11:09:15 +0000
Statistical Computations at FreeStatistics.org, Office for Research Development and Education, URL https://freestatistics.org/blog/index.php?pk=230754, Retrieved Sat, 20 Apr 2024 11:09:15 +0000
QR Codes:

Original text written by user:
IsPrivate?No (this computation is public)
User-defined keywords
Estimated Impact87
Family? (F = Feedback message, R = changed R code, M = changed R Module, P = changed Parameters, D = changed Data)
-     [Univariate Data Series] [] [2008-12-08 19:22:39] [d2d412c7f4d35ffbf5ee5ee89db327d4]
- RMPD    [(Partial) Autocorrelation Function] [] [2013-12-04 18:34:25] [be82f1b59bd963d0cf04f5c957f6be33] [Current]
Feedback Forum

Post a new message
Dataseries X:
41
39
50
40
43
38
44
35
39
35
29
49
50
59
63
32
39
47
53
60
57
52
70
90
74
62
55
84
94
70
108
139
120
97
126
149
158
124
140
109
114
77
120
133
110
92
97
78
99
107
112
90
98
125
155
190
236
189
174
178
136
161
171
149
184
155
276
224
213
279
268
287
238
213
257
293
212
246
353
339
308
247
257
322
298
273
312
249
286
279
309
401
309
328
353
354
327
324
285
243
241
287
355
460
364
487
452
391
500
451
375
372
302
316
398
394
431
431


Summary of computational transaction
Raw Inputview raw input (R code)
Raw Outputview raw output of R engine
Computing time4 seconds
R Server'Gwilym Jenkins' @ jenkins.wessa.net

\begin{tabular}{lllllllll}
\hline
Summary of computational transaction \tabularnewline
Raw Input & view raw input (R code)  \tabularnewline
Raw Output & view raw output of R engine  \tabularnewline
Computing time & 4 seconds \tabularnewline
R Server & 'Gwilym Jenkins' @ jenkins.wessa.net \tabularnewline
\hline
\end{tabular}
%Source: https://freestatistics.org/blog/index.php?pk=230754&T=0

[TABLE]
[ROW][C]Summary of computational transaction[/C][/ROW]
[ROW][C]Raw Input[/C][C]view raw input (R code) [/C][/ROW]
[ROW][C]Raw Output[/C][C]view raw output of R engine [/C][/ROW]
[ROW][C]Computing time[/C][C]4 seconds[/C][/ROW]
[ROW][C]R Server[/C][C]'Gwilym Jenkins' @ jenkins.wessa.net[/C][/ROW]
[/TABLE]
Source: https://freestatistics.org/blog/index.php?pk=230754&T=0

Globally Unique Identifier (entire table): ba.freestatistics.org/blog/index.php?pk=230754&T=0

As an alternative you can also use a QR Code:  

The GUIDs for individual cells are displayed in the table below:

Summary of computational transaction
Raw Inputview raw input (R code)
Raw Outputview raw output of R engine
Computing time4 seconds
R Server'Gwilym Jenkins' @ jenkins.wessa.net


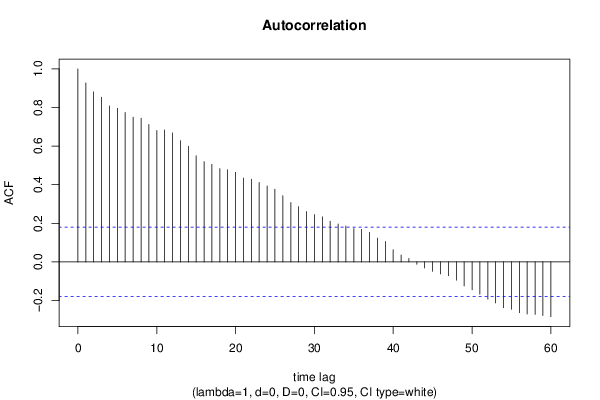
Autocorrelation Function
Time lag kACF(k)T-STATP-value
10.92765610.07690
20.8810939.57110
30.8534239.27050
40.8078368.77530
50.7965028.65220
60.7744168.41230
70.7492568.1390
80.744458.08680
90.7116737.73080
100.681217.39980
110.6839857.430
120.6684977.26170
130.6284346.82650
140.5994256.51140
150.5503815.97870
160.5194515.64270
170.5053515.48950
180.4832075.2490
190.4775995.18810
200.4645275.04611e-06
210.4341234.71583e-06
220.4280874.65024e-06
230.4115174.47029e-06
240.3936064.27571.9e-05
250.3768624.09383.9e-05
260.3430663.72670.00015
270.3071593.33660.000567
280.2863133.11020.001172
290.2608982.83410.002704
300.2449672.6610.004438
310.233342.53470.006281
320.2102582.2840.01208
330.1962492.13180.017548
340.1857952.01830.022917
350.1727061.87610.031558
360.1683771.8290.034959
370.1529821.66180.049603
380.1230351.33650.091978
390.1052981.14380.127505
400.0625160.67910.249203
410.0358820.38980.348703
420.017070.18540.426608
43-0.012611-0.1370.445634
44-0.031493-0.34210.366443
45-0.048345-0.52520.30023
46-0.062489-0.67880.249296
47-0.072099-0.78320.217541
48-0.094604-1.02770.153106
49-0.12451-1.35250.089397
50-0.144531-1.570.059546
51-0.167827-1.82310.035412
52-0.193051-2.09710.019061
53-0.212538-2.30880.011349
54-0.237937-2.58470.005483
55-0.245773-2.66980.00433
56-0.263124-2.85830.002519
57-0.270438-2.93770.001989
58-0.272326-2.95820.00187
59-0.277784-3.01750.001561
60-0.284002-3.08510.001268

\begin{tabular}{lllllllll}
\hline
Autocorrelation Function \tabularnewline
Time lag k & ACF(k) & T-STAT & P-value \tabularnewline
1 & 0.927656 & 10.0769 & 0 \tabularnewline
2 & 0.881093 & 9.5711 & 0 \tabularnewline
3 & 0.853423 & 9.2705 & 0 \tabularnewline
4 & 0.807836 & 8.7753 & 0 \tabularnewline
5 & 0.796502 & 8.6522 & 0 \tabularnewline
6 & 0.774416 & 8.4123 & 0 \tabularnewline
7 & 0.749256 & 8.139 & 0 \tabularnewline
8 & 0.74445 & 8.0868 & 0 \tabularnewline
9 & 0.711673 & 7.7308 & 0 \tabularnewline
10 & 0.68121 & 7.3998 & 0 \tabularnewline
11 & 0.683985 & 7.43 & 0 \tabularnewline
12 & 0.668497 & 7.2617 & 0 \tabularnewline
13 & 0.628434 & 6.8265 & 0 \tabularnewline
14 & 0.599425 & 6.5114 & 0 \tabularnewline
15 & 0.550381 & 5.9787 & 0 \tabularnewline
16 & 0.519451 & 5.6427 & 0 \tabularnewline
17 & 0.505351 & 5.4895 & 0 \tabularnewline
18 & 0.483207 & 5.249 & 0 \tabularnewline
19 & 0.477599 & 5.1881 & 0 \tabularnewline
20 & 0.464527 & 5.0461 & 1e-06 \tabularnewline
21 & 0.434123 & 4.7158 & 3e-06 \tabularnewline
22 & 0.428087 & 4.6502 & 4e-06 \tabularnewline
23 & 0.411517 & 4.4702 & 9e-06 \tabularnewline
24 & 0.393606 & 4.2757 & 1.9e-05 \tabularnewline
25 & 0.376862 & 4.0938 & 3.9e-05 \tabularnewline
26 & 0.343066 & 3.7267 & 0.00015 \tabularnewline
27 & 0.307159 & 3.3366 & 0.000567 \tabularnewline
28 & 0.286313 & 3.1102 & 0.001172 \tabularnewline
29 & 0.260898 & 2.8341 & 0.002704 \tabularnewline
30 & 0.244967 & 2.661 & 0.004438 \tabularnewline
31 & 0.23334 & 2.5347 & 0.006281 \tabularnewline
32 & 0.210258 & 2.284 & 0.01208 \tabularnewline
33 & 0.196249 & 2.1318 & 0.017548 \tabularnewline
34 & 0.185795 & 2.0183 & 0.022917 \tabularnewline
35 & 0.172706 & 1.8761 & 0.031558 \tabularnewline
36 & 0.168377 & 1.829 & 0.034959 \tabularnewline
37 & 0.152982 & 1.6618 & 0.049603 \tabularnewline
38 & 0.123035 & 1.3365 & 0.091978 \tabularnewline
39 & 0.105298 & 1.1438 & 0.127505 \tabularnewline
40 & 0.062516 & 0.6791 & 0.249203 \tabularnewline
41 & 0.035882 & 0.3898 & 0.348703 \tabularnewline
42 & 0.01707 & 0.1854 & 0.426608 \tabularnewline
43 & -0.012611 & -0.137 & 0.445634 \tabularnewline
44 & -0.031493 & -0.3421 & 0.366443 \tabularnewline
45 & -0.048345 & -0.5252 & 0.30023 \tabularnewline
46 & -0.062489 & -0.6788 & 0.249296 \tabularnewline
47 & -0.072099 & -0.7832 & 0.217541 \tabularnewline
48 & -0.094604 & -1.0277 & 0.153106 \tabularnewline
49 & -0.12451 & -1.3525 & 0.089397 \tabularnewline
50 & -0.144531 & -1.57 & 0.059546 \tabularnewline
51 & -0.167827 & -1.8231 & 0.035412 \tabularnewline
52 & -0.193051 & -2.0971 & 0.019061 \tabularnewline
53 & -0.212538 & -2.3088 & 0.011349 \tabularnewline
54 & -0.237937 & -2.5847 & 0.005483 \tabularnewline
55 & -0.245773 & -2.6698 & 0.00433 \tabularnewline
56 & -0.263124 & -2.8583 & 0.002519 \tabularnewline
57 & -0.270438 & -2.9377 & 0.001989 \tabularnewline
58 & -0.272326 & -2.9582 & 0.00187 \tabularnewline
59 & -0.277784 & -3.0175 & 0.001561 \tabularnewline
60 & -0.284002 & -3.0851 & 0.001268 \tabularnewline
\hline
\end{tabular}
%Source: https://freestatistics.org/blog/index.php?pk=230754&T=1

[TABLE]
[ROW][C]Autocorrelation Function[/C][/ROW]
[ROW][C]Time lag k[/C][C]ACF(k)[/C][C]T-STAT[/C][C]P-value[/C][/ROW]
[ROW][C]1[/C][C]0.927656[/C][C]10.0769[/C][C]0[/C][/ROW]
[ROW][C]2[/C][C]0.881093[/C][C]9.5711[/C][C]0[/C][/ROW]
[ROW][C]3[/C][C]0.853423[/C][C]9.2705[/C][C]0[/C][/ROW]
[ROW][C]4[/C][C]0.807836[/C][C]8.7753[/C][C]0[/C][/ROW]
[ROW][C]5[/C][C]0.796502[/C][C]8.6522[/C][C]0[/C][/ROW]
[ROW][C]6[/C][C]0.774416[/C][C]8.4123[/C][C]0[/C][/ROW]
[ROW][C]7[/C][C]0.749256[/C][C]8.139[/C][C]0[/C][/ROW]
[ROW][C]8[/C][C]0.74445[/C][C]8.0868[/C][C]0[/C][/ROW]
[ROW][C]9[/C][C]0.711673[/C][C]7.7308[/C][C]0[/C][/ROW]
[ROW][C]10[/C][C]0.68121[/C][C]7.3998[/C][C]0[/C][/ROW]
[ROW][C]11[/C][C]0.683985[/C][C]7.43[/C][C]0[/C][/ROW]
[ROW][C]12[/C][C]0.668497[/C][C]7.2617[/C][C]0[/C][/ROW]
[ROW][C]13[/C][C]0.628434[/C][C]6.8265[/C][C]0[/C][/ROW]
[ROW][C]14[/C][C]0.599425[/C][C]6.5114[/C][C]0[/C][/ROW]
[ROW][C]15[/C][C]0.550381[/C][C]5.9787[/C][C]0[/C][/ROW]
[ROW][C]16[/C][C]0.519451[/C][C]5.6427[/C][C]0[/C][/ROW]
[ROW][C]17[/C][C]0.505351[/C][C]5.4895[/C][C]0[/C][/ROW]
[ROW][C]18[/C][C]0.483207[/C][C]5.249[/C][C]0[/C][/ROW]
[ROW][C]19[/C][C]0.477599[/C][C]5.1881[/C][C]0[/C][/ROW]
[ROW][C]20[/C][C]0.464527[/C][C]5.0461[/C][C]1e-06[/C][/ROW]
[ROW][C]21[/C][C]0.434123[/C][C]4.7158[/C][C]3e-06[/C][/ROW]
[ROW][C]22[/C][C]0.428087[/C][C]4.6502[/C][C]4e-06[/C][/ROW]
[ROW][C]23[/C][C]0.411517[/C][C]4.4702[/C][C]9e-06[/C][/ROW]
[ROW][C]24[/C][C]0.393606[/C][C]4.2757[/C][C]1.9e-05[/C][/ROW]
[ROW][C]25[/C][C]0.376862[/C][C]4.0938[/C][C]3.9e-05[/C][/ROW]
[ROW][C]26[/C][C]0.343066[/C][C]3.7267[/C][C]0.00015[/C][/ROW]
[ROW][C]27[/C][C]0.307159[/C][C]3.3366[/C][C]0.000567[/C][/ROW]
[ROW][C]28[/C][C]0.286313[/C][C]3.1102[/C][C]0.001172[/C][/ROW]
[ROW][C]29[/C][C]0.260898[/C][C]2.8341[/C][C]0.002704[/C][/ROW]
[ROW][C]30[/C][C]0.244967[/C][C]2.661[/C][C]0.004438[/C][/ROW]
[ROW][C]31[/C][C]0.23334[/C][C]2.5347[/C][C]0.006281[/C][/ROW]
[ROW][C]32[/C][C]0.210258[/C][C]2.284[/C][C]0.01208[/C][/ROW]
[ROW][C]33[/C][C]0.196249[/C][C]2.1318[/C][C]0.017548[/C][/ROW]
[ROW][C]34[/C][C]0.185795[/C][C]2.0183[/C][C]0.022917[/C][/ROW]
[ROW][C]35[/C][C]0.172706[/C][C]1.8761[/C][C]0.031558[/C][/ROW]
[ROW][C]36[/C][C]0.168377[/C][C]1.829[/C][C]0.034959[/C][/ROW]
[ROW][C]37[/C][C]0.152982[/C][C]1.6618[/C][C]0.049603[/C][/ROW]
[ROW][C]38[/C][C]0.123035[/C][C]1.3365[/C][C]0.091978[/C][/ROW]
[ROW][C]39[/C][C]0.105298[/C][C]1.1438[/C][C]0.127505[/C][/ROW]
[ROW][C]40[/C][C]0.062516[/C][C]0.6791[/C][C]0.249203[/C][/ROW]
[ROW][C]41[/C][C]0.035882[/C][C]0.3898[/C][C]0.348703[/C][/ROW]
[ROW][C]42[/C][C]0.01707[/C][C]0.1854[/C][C]0.426608[/C][/ROW]
[ROW][C]43[/C][C]-0.012611[/C][C]-0.137[/C][C]0.445634[/C][/ROW]
[ROW][C]44[/C][C]-0.031493[/C][C]-0.3421[/C][C]0.366443[/C][/ROW]
[ROW][C]45[/C][C]-0.048345[/C][C]-0.5252[/C][C]0.30023[/C][/ROW]
[ROW][C]46[/C][C]-0.062489[/C][C]-0.6788[/C][C]0.249296[/C][/ROW]
[ROW][C]47[/C][C]-0.072099[/C][C]-0.7832[/C][C]0.217541[/C][/ROW]
[ROW][C]48[/C][C]-0.094604[/C][C]-1.0277[/C][C]0.153106[/C][/ROW]
[ROW][C]49[/C][C]-0.12451[/C][C]-1.3525[/C][C]0.089397[/C][/ROW]
[ROW][C]50[/C][C]-0.144531[/C][C]-1.57[/C][C]0.059546[/C][/ROW]
[ROW][C]51[/C][C]-0.167827[/C][C]-1.8231[/C][C]0.035412[/C][/ROW]
[ROW][C]52[/C][C]-0.193051[/C][C]-2.0971[/C][C]0.019061[/C][/ROW]
[ROW][C]53[/C][C]-0.212538[/C][C]-2.3088[/C][C]0.011349[/C][/ROW]
[ROW][C]54[/C][C]-0.237937[/C][C]-2.5847[/C][C]0.005483[/C][/ROW]
[ROW][C]55[/C][C]-0.245773[/C][C]-2.6698[/C][C]0.00433[/C][/ROW]
[ROW][C]56[/C][C]-0.263124[/C][C]-2.8583[/C][C]0.002519[/C][/ROW]
[ROW][C]57[/C][C]-0.270438[/C][C]-2.9377[/C][C]0.001989[/C][/ROW]
[ROW][C]58[/C][C]-0.272326[/C][C]-2.9582[/C][C]0.00187[/C][/ROW]
[ROW][C]59[/C][C]-0.277784[/C][C]-3.0175[/C][C]0.001561[/C][/ROW]
[ROW][C]60[/C][C]-0.284002[/C][C]-3.0851[/C][C]0.001268[/C][/ROW]
[/TABLE]
Source: https://freestatistics.org/blog/index.php?pk=230754&T=1

Globally Unique Identifier (entire table): ba.freestatistics.org/blog/index.php?pk=230754&T=1

As an alternative you can also use a QR Code:  

The GUIDs for individual cells are displayed in the table below:

Autocorrelation Function
Time lag kACF(k)T-STATP-value
10.92765610.07690
20.8810939.57110
30.8534239.27050
40.8078368.77530
50.7965028.65220
60.7744168.41230
70.7492568.1390
80.744458.08680
90.7116737.73080
100.681217.39980
110.6839857.430
120.6684977.26170
130.6284346.82650
140.5994256.51140
150.5503815.97870
160.5194515.64270
170.5053515.48950
180.4832075.2490
190.4775995.18810
200.4645275.04611e-06
210.4341234.71583e-06
220.4280874.65024e-06
230.4115174.47029e-06
240.3936064.27571.9e-05
250.3768624.09383.9e-05
260.3430663.72670.00015
270.3071593.33660.000567
280.2863133.11020.001172
290.2608982.83410.002704
300.2449672.6610.004438
310.233342.53470.006281
320.2102582.2840.01208
330.1962492.13180.017548
340.1857952.01830.022917
350.1727061.87610.031558
360.1683771.8290.034959
370.1529821.66180.049603
380.1230351.33650.091978
390.1052981.14380.127505
400.0625160.67910.249203
410.0358820.38980.348703
420.017070.18540.426608
43-0.012611-0.1370.445634
44-0.031493-0.34210.366443
45-0.048345-0.52520.30023
46-0.062489-0.67880.249296
47-0.072099-0.78320.217541
48-0.094604-1.02770.153106
49-0.12451-1.35250.089397
50-0.144531-1.570.059546
51-0.167827-1.82310.035412
52-0.193051-2.09710.019061
53-0.212538-2.30880.011349
54-0.237937-2.58470.005483
55-0.245773-2.66980.00433
56-0.263124-2.85830.002519
57-0.270438-2.93770.001989
58-0.272326-2.95820.00187
59-0.277784-3.01750.001561
60-0.284002-3.08510.001268


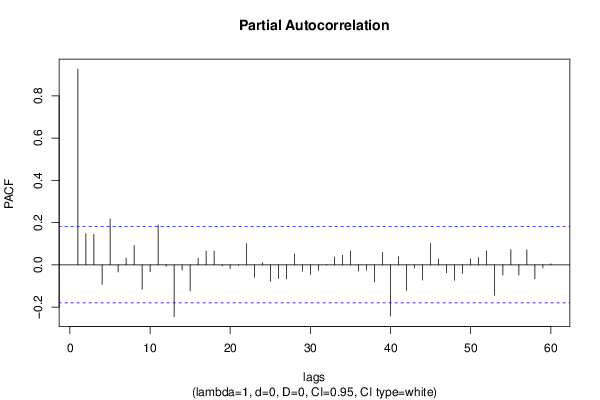
Partial Autocorrelation Function
Time lag kPACF(k)T-STATP-value
10.92765610.07690
20.1473461.60060.056071
30.1452661.5780.058622
4-0.091894-0.99820.160107
50.217082.35810.010007
6-0.033553-0.36450.358077
70.0317060.34440.365573
80.0918130.99730.160319
9-0.11603-1.26040.105005
10-0.032385-0.35180.36281
110.1880272.04250.021665
12-0.006822-0.07410.470525
13-0.245318-2.66480.004391
14-0.024909-0.27060.393592
15-0.123749-1.34430.090722
160.0314620.34180.366569
170.0652760.70910.239837
180.0654210.71070.239349
19-0.004895-0.05320.478841
20-0.017456-0.18960.424968
21-0.002401-0.02610.489618
220.1001521.08790.139421
23-0.059625-0.64770.259221
240.0100710.10940.456537
25-0.077704-0.84410.200165
26-0.064687-0.70270.241818
27-0.065825-0.7150.237996
280.0509160.55310.290626
29-0.030751-0.3340.369471
30-0.045694-0.49640.310279
31-0.025587-0.2780.390768
320.0019480.02120.491577
330.0373620.40590.342792
340.0456420.49580.310479
350.0654760.71130.239166
36-0.029606-0.32160.374162
37-0.025206-0.27380.392356
38-0.080515-0.87460.191779
390.0583110.63340.263843
40-0.24229-2.63190.004812
410.0382590.41560.33923
42-0.122304-1.32860.093278
43-0.014721-0.15990.436611
44-0.071922-0.78130.218103
450.1014891.10250.136254
460.0269820.29310.384982
47-0.037626-0.40870.341741
48-0.073236-0.79550.213947
49-0.040345-0.43830.331
500.028850.31340.377268
510.0342690.37230.355186
520.0666710.72420.235178
53-0.143378-1.55750.061017
54-0.048456-0.52640.299811
550.0721410.78370.217406
56-0.048183-0.52340.30084
570.0709460.77070.221221
58-0.06599-0.71680.237446
59-0.014277-0.15510.438507
600.0050580.05490.478137

\begin{tabular}{lllllllll}
\hline
Partial Autocorrelation Function \tabularnewline
Time lag k & PACF(k) & T-STAT & P-value \tabularnewline
1 & 0.927656 & 10.0769 & 0 \tabularnewline
2 & 0.147346 & 1.6006 & 0.056071 \tabularnewline
3 & 0.145266 & 1.578 & 0.058622 \tabularnewline
4 & -0.091894 & -0.9982 & 0.160107 \tabularnewline
5 & 0.21708 & 2.3581 & 0.010007 \tabularnewline
6 & -0.033553 & -0.3645 & 0.358077 \tabularnewline
7 & 0.031706 & 0.3444 & 0.365573 \tabularnewline
8 & 0.091813 & 0.9973 & 0.160319 \tabularnewline
9 & -0.11603 & -1.2604 & 0.105005 \tabularnewline
10 & -0.032385 & -0.3518 & 0.36281 \tabularnewline
11 & 0.188027 & 2.0425 & 0.021665 \tabularnewline
12 & -0.006822 & -0.0741 & 0.470525 \tabularnewline
13 & -0.245318 & -2.6648 & 0.004391 \tabularnewline
14 & -0.024909 & -0.2706 & 0.393592 \tabularnewline
15 & -0.123749 & -1.3443 & 0.090722 \tabularnewline
16 & 0.031462 & 0.3418 & 0.366569 \tabularnewline
17 & 0.065276 & 0.7091 & 0.239837 \tabularnewline
18 & 0.065421 & 0.7107 & 0.239349 \tabularnewline
19 & -0.004895 & -0.0532 & 0.478841 \tabularnewline
20 & -0.017456 & -0.1896 & 0.424968 \tabularnewline
21 & -0.002401 & -0.0261 & 0.489618 \tabularnewline
22 & 0.100152 & 1.0879 & 0.139421 \tabularnewline
23 & -0.059625 & -0.6477 & 0.259221 \tabularnewline
24 & 0.010071 & 0.1094 & 0.456537 \tabularnewline
25 & -0.077704 & -0.8441 & 0.200165 \tabularnewline
26 & -0.064687 & -0.7027 & 0.241818 \tabularnewline
27 & -0.065825 & -0.715 & 0.237996 \tabularnewline
28 & 0.050916 & 0.5531 & 0.290626 \tabularnewline
29 & -0.030751 & -0.334 & 0.369471 \tabularnewline
30 & -0.045694 & -0.4964 & 0.310279 \tabularnewline
31 & -0.025587 & -0.278 & 0.390768 \tabularnewline
32 & 0.001948 & 0.0212 & 0.491577 \tabularnewline
33 & 0.037362 & 0.4059 & 0.342792 \tabularnewline
34 & 0.045642 & 0.4958 & 0.310479 \tabularnewline
35 & 0.065476 & 0.7113 & 0.239166 \tabularnewline
36 & -0.029606 & -0.3216 & 0.374162 \tabularnewline
37 & -0.025206 & -0.2738 & 0.392356 \tabularnewline
38 & -0.080515 & -0.8746 & 0.191779 \tabularnewline
39 & 0.058311 & 0.6334 & 0.263843 \tabularnewline
40 & -0.24229 & -2.6319 & 0.004812 \tabularnewline
41 & 0.038259 & 0.4156 & 0.33923 \tabularnewline
42 & -0.122304 & -1.3286 & 0.093278 \tabularnewline
43 & -0.014721 & -0.1599 & 0.436611 \tabularnewline
44 & -0.071922 & -0.7813 & 0.218103 \tabularnewline
45 & 0.101489 & 1.1025 & 0.136254 \tabularnewline
46 & 0.026982 & 0.2931 & 0.384982 \tabularnewline
47 & -0.037626 & -0.4087 & 0.341741 \tabularnewline
48 & -0.073236 & -0.7955 & 0.213947 \tabularnewline
49 & -0.040345 & -0.4383 & 0.331 \tabularnewline
50 & 0.02885 & 0.3134 & 0.377268 \tabularnewline
51 & 0.034269 & 0.3723 & 0.355186 \tabularnewline
52 & 0.066671 & 0.7242 & 0.235178 \tabularnewline
53 & -0.143378 & -1.5575 & 0.061017 \tabularnewline
54 & -0.048456 & -0.5264 & 0.299811 \tabularnewline
55 & 0.072141 & 0.7837 & 0.217406 \tabularnewline
56 & -0.048183 & -0.5234 & 0.30084 \tabularnewline
57 & 0.070946 & 0.7707 & 0.221221 \tabularnewline
58 & -0.06599 & -0.7168 & 0.237446 \tabularnewline
59 & -0.014277 & -0.1551 & 0.438507 \tabularnewline
60 & 0.005058 & 0.0549 & 0.478137 \tabularnewline
\hline
\end{tabular}
%Source: https://freestatistics.org/blog/index.php?pk=230754&T=2

[TABLE]
[ROW][C]Partial Autocorrelation Function[/C][/ROW]
[ROW][C]Time lag k[/C][C]PACF(k)[/C][C]T-STAT[/C][C]P-value[/C][/ROW]
[ROW][C]1[/C][C]0.927656[/C][C]10.0769[/C][C]0[/C][/ROW]
[ROW][C]2[/C][C]0.147346[/C][C]1.6006[/C][C]0.056071[/C][/ROW]
[ROW][C]3[/C][C]0.145266[/C][C]1.578[/C][C]0.058622[/C][/ROW]
[ROW][C]4[/C][C]-0.091894[/C][C]-0.9982[/C][C]0.160107[/C][/ROW]
[ROW][C]5[/C][C]0.21708[/C][C]2.3581[/C][C]0.010007[/C][/ROW]
[ROW][C]6[/C][C]-0.033553[/C][C]-0.3645[/C][C]0.358077[/C][/ROW]
[ROW][C]7[/C][C]0.031706[/C][C]0.3444[/C][C]0.365573[/C][/ROW]
[ROW][C]8[/C][C]0.091813[/C][C]0.9973[/C][C]0.160319[/C][/ROW]
[ROW][C]9[/C][C]-0.11603[/C][C]-1.2604[/C][C]0.105005[/C][/ROW]
[ROW][C]10[/C][C]-0.032385[/C][C]-0.3518[/C][C]0.36281[/C][/ROW]
[ROW][C]11[/C][C]0.188027[/C][C]2.0425[/C][C]0.021665[/C][/ROW]
[ROW][C]12[/C][C]-0.006822[/C][C]-0.0741[/C][C]0.470525[/C][/ROW]
[ROW][C]13[/C][C]-0.245318[/C][C]-2.6648[/C][C]0.004391[/C][/ROW]
[ROW][C]14[/C][C]-0.024909[/C][C]-0.2706[/C][C]0.393592[/C][/ROW]
[ROW][C]15[/C][C]-0.123749[/C][C]-1.3443[/C][C]0.090722[/C][/ROW]
[ROW][C]16[/C][C]0.031462[/C][C]0.3418[/C][C]0.366569[/C][/ROW]
[ROW][C]17[/C][C]0.065276[/C][C]0.7091[/C][C]0.239837[/C][/ROW]
[ROW][C]18[/C][C]0.065421[/C][C]0.7107[/C][C]0.239349[/C][/ROW]
[ROW][C]19[/C][C]-0.004895[/C][C]-0.0532[/C][C]0.478841[/C][/ROW]
[ROW][C]20[/C][C]-0.017456[/C][C]-0.1896[/C][C]0.424968[/C][/ROW]
[ROW][C]21[/C][C]-0.002401[/C][C]-0.0261[/C][C]0.489618[/C][/ROW]
[ROW][C]22[/C][C]0.100152[/C][C]1.0879[/C][C]0.139421[/C][/ROW]
[ROW][C]23[/C][C]-0.059625[/C][C]-0.6477[/C][C]0.259221[/C][/ROW]
[ROW][C]24[/C][C]0.010071[/C][C]0.1094[/C][C]0.456537[/C][/ROW]
[ROW][C]25[/C][C]-0.077704[/C][C]-0.8441[/C][C]0.200165[/C][/ROW]
[ROW][C]26[/C][C]-0.064687[/C][C]-0.7027[/C][C]0.241818[/C][/ROW]
[ROW][C]27[/C][C]-0.065825[/C][C]-0.715[/C][C]0.237996[/C][/ROW]
[ROW][C]28[/C][C]0.050916[/C][C]0.5531[/C][C]0.290626[/C][/ROW]
[ROW][C]29[/C][C]-0.030751[/C][C]-0.334[/C][C]0.369471[/C][/ROW]
[ROW][C]30[/C][C]-0.045694[/C][C]-0.4964[/C][C]0.310279[/C][/ROW]
[ROW][C]31[/C][C]-0.025587[/C][C]-0.278[/C][C]0.390768[/C][/ROW]
[ROW][C]32[/C][C]0.001948[/C][C]0.0212[/C][C]0.491577[/C][/ROW]
[ROW][C]33[/C][C]0.037362[/C][C]0.4059[/C][C]0.342792[/C][/ROW]
[ROW][C]34[/C][C]0.045642[/C][C]0.4958[/C][C]0.310479[/C][/ROW]
[ROW][C]35[/C][C]0.065476[/C][C]0.7113[/C][C]0.239166[/C][/ROW]
[ROW][C]36[/C][C]-0.029606[/C][C]-0.3216[/C][C]0.374162[/C][/ROW]
[ROW][C]37[/C][C]-0.025206[/C][C]-0.2738[/C][C]0.392356[/C][/ROW]
[ROW][C]38[/C][C]-0.080515[/C][C]-0.8746[/C][C]0.191779[/C][/ROW]
[ROW][C]39[/C][C]0.058311[/C][C]0.6334[/C][C]0.263843[/C][/ROW]
[ROW][C]40[/C][C]-0.24229[/C][C]-2.6319[/C][C]0.004812[/C][/ROW]
[ROW][C]41[/C][C]0.038259[/C][C]0.4156[/C][C]0.33923[/C][/ROW]
[ROW][C]42[/C][C]-0.122304[/C][C]-1.3286[/C][C]0.093278[/C][/ROW]
[ROW][C]43[/C][C]-0.014721[/C][C]-0.1599[/C][C]0.436611[/C][/ROW]
[ROW][C]44[/C][C]-0.071922[/C][C]-0.7813[/C][C]0.218103[/C][/ROW]
[ROW][C]45[/C][C]0.101489[/C][C]1.1025[/C][C]0.136254[/C][/ROW]
[ROW][C]46[/C][C]0.026982[/C][C]0.2931[/C][C]0.384982[/C][/ROW]
[ROW][C]47[/C][C]-0.037626[/C][C]-0.4087[/C][C]0.341741[/C][/ROW]
[ROW][C]48[/C][C]-0.073236[/C][C]-0.7955[/C][C]0.213947[/C][/ROW]
[ROW][C]49[/C][C]-0.040345[/C][C]-0.4383[/C][C]0.331[/C][/ROW]
[ROW][C]50[/C][C]0.02885[/C][C]0.3134[/C][C]0.377268[/C][/ROW]
[ROW][C]51[/C][C]0.034269[/C][C]0.3723[/C][C]0.355186[/C][/ROW]
[ROW][C]52[/C][C]0.066671[/C][C]0.7242[/C][C]0.235178[/C][/ROW]
[ROW][C]53[/C][C]-0.143378[/C][C]-1.5575[/C][C]0.061017[/C][/ROW]
[ROW][C]54[/C][C]-0.048456[/C][C]-0.5264[/C][C]0.299811[/C][/ROW]
[ROW][C]55[/C][C]0.072141[/C][C]0.7837[/C][C]0.217406[/C][/ROW]
[ROW][C]56[/C][C]-0.048183[/C][C]-0.5234[/C][C]0.30084[/C][/ROW]
[ROW][C]57[/C][C]0.070946[/C][C]0.7707[/C][C]0.221221[/C][/ROW]
[ROW][C]58[/C][C]-0.06599[/C][C]-0.7168[/C][C]0.237446[/C][/ROW]
[ROW][C]59[/C][C]-0.014277[/C][C]-0.1551[/C][C]0.438507[/C][/ROW]
[ROW][C]60[/C][C]0.005058[/C][C]0.0549[/C][C]0.478137[/C][/ROW]
[/TABLE]
Source: https://freestatistics.org/blog/index.php?pk=230754&T=2

Globally Unique Identifier (entire table): ba.freestatistics.org/blog/index.php?pk=230754&T=2

As an alternative you can also use a QR Code:  

The GUIDs for individual cells are displayed in the table below:

Partial Autocorrelation Function
Time lag kPACF(k)T-STATP-value
10.92765610.07690
20.1473461.60060.056071
30.1452661.5780.058622
4-0.091894-0.99820.160107
50.217082.35810.010007
6-0.033553-0.36450.358077
70.0317060.34440.365573
80.0918130.99730.160319
9-0.11603-1.26040.105005
10-0.032385-0.35180.36281
110.1880272.04250.021665
12-0.006822-0.07410.470525
13-0.245318-2.66480.004391
14-0.024909-0.27060.393592
15-0.123749-1.34430.090722
160.0314620.34180.366569
170.0652760.70910.239837
180.0654210.71070.239349
19-0.004895-0.05320.478841
20-0.017456-0.18960.424968
21-0.002401-0.02610.489618
220.1001521.08790.139421
23-0.059625-0.64770.259221
240.0100710.10940.456537
25-0.077704-0.84410.200165
26-0.064687-0.70270.241818
27-0.065825-0.7150.237996
280.0509160.55310.290626
29-0.030751-0.3340.369471
30-0.045694-0.49640.310279
31-0.025587-0.2780.390768
320.0019480.02120.491577
330.0373620.40590.342792
340.0456420.49580.310479
350.0654760.71130.239166
36-0.029606-0.32160.374162
37-0.025206-0.27380.392356
38-0.080515-0.87460.191779
390.0583110.63340.263843
40-0.24229-2.63190.004812
410.0382590.41560.33923
42-0.122304-1.32860.093278
43-0.014721-0.15990.436611
44-0.071922-0.78130.218103
450.1014891.10250.136254
460.0269820.29310.384982
47-0.037626-0.40870.341741
48-0.073236-0.79550.213947
49-0.040345-0.43830.331
500.028850.31340.377268
510.0342690.37230.355186
520.0666710.72420.235178
53-0.143378-1.55750.061017
54-0.048456-0.52640.299811
550.0721410.78370.217406
56-0.048183-0.52340.30084
570.0709460.77070.221221
58-0.06599-0.71680.237446
59-0.014277-0.15510.438507
600.0050580.05490.478137


Parameters (Session):
par1 = 60 ; par2 = 1 ; par3 = 0 ; par4 = 0 ; par5 = 12 ; par6 = White Noise ; par7 = 0.95 ;
Parameters (R input):
par1 = 60 ; par2 = 1 ; par3 = 0 ; par4 = 0 ; par5 = 12 ; par6 = White Noise ; par7 = 0.95 ; par8 = ;
R code (references can be found in the software module):
if (par1 == 'Default') {
par1 = 10*log10(length(x))
} else {
par1 <- as.numeric(par1)
}
par2 <- as.numeric(par2)
par3 <- as.numeric(par3)
par4 <- as.numeric(par4)
par5 <- as.numeric(par5)
if (par6 == 'White Noise') par6 <- 'white' else par6 <- 'ma'
par7 <- as.numeric(par7)
if (par8 != '') par8 <- as.numeric(par8)
ox <- x
if (par8 == '') {
if (par2 == 0) {
x <- log(x)
} else {
x <- (x ^ par2 - 1) / par2
}
} else {
x <- log(x,base=par8)
}
if (par3 > 0) x <- diff(x,lag=1,difference=par3)
if (par4 > 0) x <- diff(x,lag=par5,difference=par4)
bitmap(file='picts.png')
op <- par(mfrow=c(2,1))
plot(ox,type='l',main='Original Time Series',xlab='time',ylab='value')
if (par8=='') {
mytitle <- paste('Working Time Series (lambda=',par2,', d=',par3,', D=',par4,')',sep='')
mysub <- paste('(lambda=',par2,', d=',par3,', D=',par4,', CI=', par7, ', CI type=',par6,')',sep='')
} else {
mytitle <- paste('Working Time Series (base=',par8,', d=',par3,', D=',par4,')',sep='')
mysub <- paste('(base=',par8,', d=',par3,', D=',par4,', CI=', par7, ', CI type=',par6,')',sep='')
}
plot(x,type='l', main=mytitle,xlab='time',ylab='value')
par(op)
dev.off()
bitmap(file='pic1.png')
racf <- acf(x, par1, main='Autocorrelation', xlab='time lag', ylab='ACF', ci.type=par6, ci=par7, sub=mysub)
dev.off()
bitmap(file='pic2.png')
rpacf <- pacf(x,par1,main='Partial Autocorrelation',xlab='lags',ylab='PACF',sub=mysub)
dev.off()
(myacf <- c(racf$acf))
(mypacf <- c(rpacf$acf))
lengthx <- length(x)
sqrtn <- sqrt(lengthx)
load(file='createtable')
a<-table.start()
a<-table.row.start(a)
a<-table.element(a,'Autocorrelation Function',4,TRUE)
a<-table.row.end(a)
a<-table.row.start(a)
a<-table.element(a,'Time lag k',header=TRUE)
a<-table.element(a,hyperlink('basics.htm','ACF(k)','click here for more information about the Autocorrelation Function'),header=TRUE)
a<-table.element(a,'T-STAT',header=TRUE)
a<-table.element(a,'P-value',header=TRUE)
a<-table.row.end(a)
for (i in 2:(par1+1)) {
a<-table.row.start(a)
a<-table.element(a,i-1,header=TRUE)
a<-table.element(a,round(myacf[i],6))
mytstat <- myacf[i]*sqrtn
a<-table.element(a,round(mytstat,4))
a<-table.element(a,round(1-pt(abs(mytstat),lengthx),6))
a<-table.row.end(a)
}
a<-table.end(a)
table.save(a,file='mytable.tab')
a<-table.start()
a<-table.row.start(a)
a<-table.element(a,'Partial Autocorrelation Function',4,TRUE)
a<-table.row.end(a)
a<-table.row.start(a)
a<-table.element(a,'Time lag k',header=TRUE)
a<-table.element(a,hyperlink('basics.htm','PACF(k)','click here for more information about the Partial Autocorrelation Function'),header=TRUE)
a<-table.element(a,'T-STAT',header=TRUE)
a<-table.element(a,'P-value',header=TRUE)
a<-table.row.end(a)
for (i in 1:par1) {
a<-table.row.start(a)
a<-table.element(a,i,header=TRUE)
a<-table.element(a,round(mypacf[i],6))
mytstat <- mypacf[i]*sqrtn
a<-table.element(a,round(mytstat,4))
a<-table.element(a,round(1-pt(abs(mytstat),lengthx),6))
a<-table.row.end(a)
}
a<-table.end(a)
table.save(a,file='mytable1.tab')