Free Statistics

of Irreproducible Research!

Author's title

Author*The author of this computation has been verified*
R Software Modulerwasp_arimabackwardselection.wasp
Title produced by softwareARIMA Backward Selection
Date of computationWed, 04 Dec 2013 15:36:27 -0500
Cite this page as followsStatistical Computations at FreeStatistics.org, Office for Research Development and Education, URL https://freestatistics.org/blog/index.php?v=date/2013/Dec/04/t1386189480gan5j9nkuqrm52a.htm/, Retrieved Tue, 16 Apr 2024 07:17:04 +0000
Statistical Computations at FreeStatistics.org, Office for Research Development and Education, URL https://freestatistics.org/blog/index.php?pk=230804, Retrieved Tue, 16 Apr 2024 07:17:04 +0000
QR Codes:

Original text written by user:
IsPrivate?No (this computation is public)
User-defined keywords
Estimated Impact70
Family? (F = Feedback message, R = changed R code, M = changed R Module, P = changed Parameters, D = changed Data)
-       [ARIMA Backward Selection] [WS9] [2013-12-04 20:36:27] [104b0db68bda9d3dffe7827591dbf02b] [Current]
Feedback Forum

Post a new message
Dataseries X:
9700
9081
9084
9743
8587
9731
9563
9998
9437
10038
9918
9252
9737
9035
9133
9487
8700
9627
8947
9283
8829
9947
9628
9318
9605
8640
9214
9567
8547
9185
9470
9123
9278
10170
9434
9655
9429
8739
9552
9687
9019
9672
9206
9069
9788
10312
10105
9863
9656
9295
9946
9701
9049
10190
9706
9765
9893
9994
10433
10073
10112
9266
9820
10097
9115
10411
9678
10408
10153
10368
10581
10597
10680
9738
9556


Summary of computational transaction
Raw Inputview raw input (R code)
Raw Outputview raw output of R engine
Computing time10 seconds
R Server'Sir Ronald Aylmer Fisher' @ fisher.wessa.net

\begin{tabular}{lllllllll}
\hline
Summary of computational transaction \tabularnewline
Raw Input & view raw input (R code)  \tabularnewline
Raw Output & view raw output of R engine  \tabularnewline
Computing time & 10 seconds \tabularnewline
R Server & 'Sir Ronald Aylmer Fisher' @ fisher.wessa.net \tabularnewline
\hline
\end{tabular}
%Source: https://freestatistics.org/blog/index.php?pk=230804&T=0

[TABLE]
[ROW][C]Summary of computational transaction[/C][/ROW]
[ROW][C]Raw Input[/C][C]view raw input (R code) [/C][/ROW]
[ROW][C]Raw Output[/C][C]view raw output of R engine [/C][/ROW]
[ROW][C]Computing time[/C][C]10 seconds[/C][/ROW]
[ROW][C]R Server[/C][C]'Sir Ronald Aylmer Fisher' @ fisher.wessa.net[/C][/ROW]
[/TABLE]
Source: https://freestatistics.org/blog/index.php?pk=230804&T=0

Globally Unique Identifier (entire table): ba.freestatistics.org/blog/index.php?pk=230804&T=0

As an alternative you can also use a QR Code:  

The GUIDs for individual cells are displayed in the table below:

Summary of computational transaction
Raw Inputview raw input (R code)
Raw Outputview raw output of R engine
Computing time10 seconds
R Server'Sir Ronald Aylmer Fisher' @ fisher.wessa.net


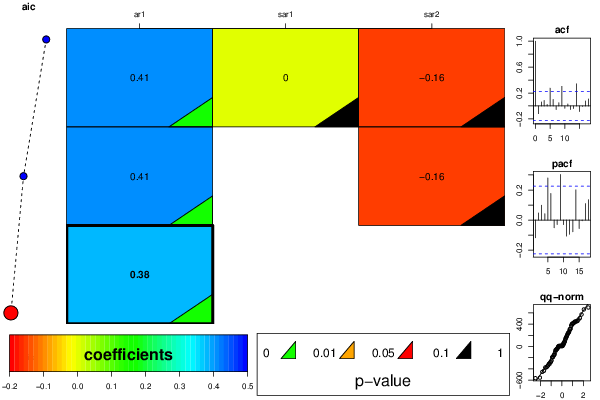
ARIMA Parameter Estimation and Backward Selection
Iterationar1sar1sar2
Estimates ( 1 )0.41380.0044-0.1572
(p-val)(0.0014 )(0.976 )(0.3462 )
Estimates ( 2 )0.4150-0.1578
(p-val)(8e-04 )(NA )(0.3403 )
Estimates ( 3 )0.381300
(p-val)(0.0015 )(NA )(NA )
Estimates ( 4 )NANANA
(p-val)(NA )(NA )(NA )
Estimates ( 5 )NANANA
(p-val)(NA )(NA )(NA )

\begin{tabular}{lllllllll}
\hline
ARIMA Parameter Estimation and Backward Selection \tabularnewline
Iteration & ar1 & sar1 & sar2 \tabularnewline
Estimates ( 1 ) & 0.4138 & 0.0044 & -0.1572 \tabularnewline
(p-val) & (0.0014 ) & (0.976 ) & (0.3462 ) \tabularnewline
Estimates ( 2 ) & 0.415 & 0 & -0.1578 \tabularnewline
(p-val) & (8e-04 ) & (NA ) & (0.3403 ) \tabularnewline
Estimates ( 3 ) & 0.3813 & 0 & 0 \tabularnewline
(p-val) & (0.0015 ) & (NA ) & (NA ) \tabularnewline
Estimates ( 4 ) & NA & NA & NA \tabularnewline
(p-val) & (NA ) & (NA ) & (NA ) \tabularnewline
Estimates ( 5 ) & NA & NA & NA \tabularnewline
(p-val) & (NA ) & (NA ) & (NA ) \tabularnewline
\hline
\end{tabular}
%Source: https://freestatistics.org/blog/index.php?pk=230804&T=1

[TABLE]
[ROW][C]ARIMA Parameter Estimation and Backward Selection[/C][/ROW]
[ROW][C]Iteration[/C][C]ar1[/C][C]sar1[/C][C]sar2[/C][/ROW]
[ROW][C]Estimates ( 1 )[/C][C]0.4138[/C][C]0.0044[/C][C]-0.1572[/C][/ROW]
[ROW][C](p-val)[/C][C](0.0014 )[/C][C](0.976 )[/C][C](0.3462 )[/C][/ROW]
[ROW][C]Estimates ( 2 )[/C][C]0.415[/C][C]0[/C][C]-0.1578[/C][/ROW]
[ROW][C](p-val)[/C][C](8e-04 )[/C][C](NA )[/C][C](0.3403 )[/C][/ROW]
[ROW][C]Estimates ( 3 )[/C][C]0.3813[/C][C]0[/C][C]0[/C][/ROW]
[ROW][C](p-val)[/C][C](0.0015 )[/C][C](NA )[/C][C](NA )[/C][/ROW]
[ROW][C]Estimates ( 4 )[/C][C]NA[/C][C]NA[/C][C]NA[/C][/ROW]
[ROW][C](p-val)[/C][C](NA )[/C][C](NA )[/C][C](NA )[/C][/ROW]
[ROW][C]Estimates ( 5 )[/C][C]NA[/C][C]NA[/C][C]NA[/C][/ROW]
[ROW][C](p-val)[/C][C](NA )[/C][C](NA )[/C][C](NA )[/C][/ROW]
[/TABLE]
Source: https://freestatistics.org/blog/index.php?pk=230804&T=1

Globally Unique Identifier (entire table): ba.freestatistics.org/blog/index.php?pk=230804&T=1

As an alternative you can also use a QR Code:  

The GUIDs for individual cells are displayed in the table below:

ARIMA Parameter Estimation and Backward Selection
Iterationar1sar1sar2
Estimates ( 1 )0.41380.0044-0.1572
(p-val)(0.0014 )(0.976 )(0.3462 )
Estimates ( 2 )0.4150-0.1578
(p-val)(8e-04 )(NA )(0.3403 )
Estimates ( 3 )0.381300
(p-val)(0.0015 )(NA )(NA )
Estimates ( 4 )NANANA
(p-val)(NA )(NA )(NA )
Estimates ( 5 )NANANA
(p-val)(NA )(NA )(NA )


Estimated ARIMA Residuals
Value
9.2519855791713
33.2345126407141
-60.5845993345588
67.2348567365614
-272.869396361898
216.482727905498
-148.999507828483
-565.663130056177
-453.623782525385
-307.398500910348
159.276434659441
-249.076000614988
184.004918460781
-157.386989163989
-335.957240555811
241.84406801903
45.8107688201658
-183.856473784263
-373.753147603511
697.586279284026
-372.238677884306
509.081272086957
36.5862262707796
-282.151498447702
414.708112863414
-307.430767230961
162.349714230484
307.665502884371
-63.8737633802419
456.807304021752
267.320643048785
-556.504073674585
-16.9575418006611
483.272919493721
-44.1726434750134
572.262285474726
-41.0293519279877
115.530037571737
408.10272149556
201.936282228419
-142.174033717103
-5.19850747978896
445.807676670421
396.547748777883
429.008879878677
-102.466065794422
-355.781532958392
414.732083480963
139.789716296051
319.005501115972
-191.070107707836
-67.1009632169346
445.088005216931
-31.6857908545021
239.564903635734
-193.273434669844
663.386980450754
77.2124557754236
255.118828866028
89.4122742424473
451.46707384222
372.764717080713
309.190610664184
-434.091191807453

\begin{tabular}{lllllllll}
\hline
Estimated ARIMA Residuals \tabularnewline
Value \tabularnewline
9.2519855791713 \tabularnewline
33.2345126407141 \tabularnewline
-60.5845993345588 \tabularnewline
67.2348567365614 \tabularnewline
-272.869396361898 \tabularnewline
216.482727905498 \tabularnewline
-148.999507828483 \tabularnewline
-565.663130056177 \tabularnewline
-453.623782525385 \tabularnewline
-307.398500910348 \tabularnewline
159.276434659441 \tabularnewline
-249.076000614988 \tabularnewline
184.004918460781 \tabularnewline
-157.386989163989 \tabularnewline
-335.957240555811 \tabularnewline
241.84406801903 \tabularnewline
45.8107688201658 \tabularnewline
-183.856473784263 \tabularnewline
-373.753147603511 \tabularnewline
697.586279284026 \tabularnewline
-372.238677884306 \tabularnewline
509.081272086957 \tabularnewline
36.5862262707796 \tabularnewline
-282.151498447702 \tabularnewline
414.708112863414 \tabularnewline
-307.430767230961 \tabularnewline
162.349714230484 \tabularnewline
307.665502884371 \tabularnewline
-63.8737633802419 \tabularnewline
456.807304021752 \tabularnewline
267.320643048785 \tabularnewline
-556.504073674585 \tabularnewline
-16.9575418006611 \tabularnewline
483.272919493721 \tabularnewline
-44.1726434750134 \tabularnewline
572.262285474726 \tabularnewline
-41.0293519279877 \tabularnewline
115.530037571737 \tabularnewline
408.10272149556 \tabularnewline
201.936282228419 \tabularnewline
-142.174033717103 \tabularnewline
-5.19850747978896 \tabularnewline
445.807676670421 \tabularnewline
396.547748777883 \tabularnewline
429.008879878677 \tabularnewline
-102.466065794422 \tabularnewline
-355.781532958392 \tabularnewline
414.732083480963 \tabularnewline
139.789716296051 \tabularnewline
319.005501115972 \tabularnewline
-191.070107707836 \tabularnewline
-67.1009632169346 \tabularnewline
445.088005216931 \tabularnewline
-31.6857908545021 \tabularnewline
239.564903635734 \tabularnewline
-193.273434669844 \tabularnewline
663.386980450754 \tabularnewline
77.2124557754236 \tabularnewline
255.118828866028 \tabularnewline
89.4122742424473 \tabularnewline
451.46707384222 \tabularnewline
372.764717080713 \tabularnewline
309.190610664184 \tabularnewline
-434.091191807453 \tabularnewline
\hline
\end{tabular}
%Source: https://freestatistics.org/blog/index.php?pk=230804&T=2

[TABLE]
[ROW][C]Estimated ARIMA Residuals[/C][/ROW]
[ROW][C]Value[/C][/ROW]
[ROW][C]9.2519855791713[/C][/ROW]
[ROW][C]33.2345126407141[/C][/ROW]
[ROW][C]-60.5845993345588[/C][/ROW]
[ROW][C]67.2348567365614[/C][/ROW]
[ROW][C]-272.869396361898[/C][/ROW]
[ROW][C]216.482727905498[/C][/ROW]
[ROW][C]-148.999507828483[/C][/ROW]
[ROW][C]-565.663130056177[/C][/ROW]
[ROW][C]-453.623782525385[/C][/ROW]
[ROW][C]-307.398500910348[/C][/ROW]
[ROW][C]159.276434659441[/C][/ROW]
[ROW][C]-249.076000614988[/C][/ROW]
[ROW][C]184.004918460781[/C][/ROW]
[ROW][C]-157.386989163989[/C][/ROW]
[ROW][C]-335.957240555811[/C][/ROW]
[ROW][C]241.84406801903[/C][/ROW]
[ROW][C]45.8107688201658[/C][/ROW]
[ROW][C]-183.856473784263[/C][/ROW]
[ROW][C]-373.753147603511[/C][/ROW]
[ROW][C]697.586279284026[/C][/ROW]
[ROW][C]-372.238677884306[/C][/ROW]
[ROW][C]509.081272086957[/C][/ROW]
[ROW][C]36.5862262707796[/C][/ROW]
[ROW][C]-282.151498447702[/C][/ROW]
[ROW][C]414.708112863414[/C][/ROW]
[ROW][C]-307.430767230961[/C][/ROW]
[ROW][C]162.349714230484[/C][/ROW]
[ROW][C]307.665502884371[/C][/ROW]
[ROW][C]-63.8737633802419[/C][/ROW]
[ROW][C]456.807304021752[/C][/ROW]
[ROW][C]267.320643048785[/C][/ROW]
[ROW][C]-556.504073674585[/C][/ROW]
[ROW][C]-16.9575418006611[/C][/ROW]
[ROW][C]483.272919493721[/C][/ROW]
[ROW][C]-44.1726434750134[/C][/ROW]
[ROW][C]572.262285474726[/C][/ROW]
[ROW][C]-41.0293519279877[/C][/ROW]
[ROW][C]115.530037571737[/C][/ROW]
[ROW][C]408.10272149556[/C][/ROW]
[ROW][C]201.936282228419[/C][/ROW]
[ROW][C]-142.174033717103[/C][/ROW]
[ROW][C]-5.19850747978896[/C][/ROW]
[ROW][C]445.807676670421[/C][/ROW]
[ROW][C]396.547748777883[/C][/ROW]
[ROW][C]429.008879878677[/C][/ROW]
[ROW][C]-102.466065794422[/C][/ROW]
[ROW][C]-355.781532958392[/C][/ROW]
[ROW][C]414.732083480963[/C][/ROW]
[ROW][C]139.789716296051[/C][/ROW]
[ROW][C]319.005501115972[/C][/ROW]
[ROW][C]-191.070107707836[/C][/ROW]
[ROW][C]-67.1009632169346[/C][/ROW]
[ROW][C]445.088005216931[/C][/ROW]
[ROW][C]-31.6857908545021[/C][/ROW]
[ROW][C]239.564903635734[/C][/ROW]
[ROW][C]-193.273434669844[/C][/ROW]
[ROW][C]663.386980450754[/C][/ROW]
[ROW][C]77.2124557754236[/C][/ROW]
[ROW][C]255.118828866028[/C][/ROW]
[ROW][C]89.4122742424473[/C][/ROW]
[ROW][C]451.46707384222[/C][/ROW]
[ROW][C]372.764717080713[/C][/ROW]
[ROW][C]309.190610664184[/C][/ROW]
[ROW][C]-434.091191807453[/C][/ROW]
[/TABLE]
Source: https://freestatistics.org/blog/index.php?pk=230804&T=2

Globally Unique Identifier (entire table): ba.freestatistics.org/blog/index.php?pk=230804&T=2

As an alternative you can also use a QR Code:  

The GUIDs for individual cells are displayed in the table below:

Estimated ARIMA Residuals
Value
9.2519855791713
33.2345126407141
-60.5845993345588
67.2348567365614
-272.869396361898
216.482727905498
-148.999507828483
-565.663130056177
-453.623782525385
-307.398500910348
159.276434659441
-249.076000614988
184.004918460781
-157.386989163989
-335.957240555811
241.84406801903
45.8107688201658
-183.856473784263
-373.753147603511
697.586279284026
-372.238677884306
509.081272086957
36.5862262707796
-282.151498447702
414.708112863414
-307.430767230961
162.349714230484
307.665502884371
-63.8737633802419
456.807304021752
267.320643048785
-556.504073674585
-16.9575418006611
483.272919493721
-44.1726434750134
572.262285474726
-41.0293519279877
115.530037571737
408.10272149556
201.936282228419
-142.174033717103
-5.19850747978896
445.807676670421
396.547748777883
429.008879878677
-102.466065794422
-355.781532958392
414.732083480963
139.789716296051
319.005501115972
-191.070107707836
-67.1009632169346
445.088005216931
-31.6857908545021
239.564903635734
-193.273434669844
663.386980450754
77.2124557754236
255.118828866028
89.4122742424473
451.46707384222
372.764717080713
309.190610664184
-434.091191807453


Parameters (Session):
par1 = FALSE ; par2 = 1 ; par3 = 0 ; par4 = 1 ; par5 = 12 ; par6 = 1 ; par7 = 0 ; par8 = 2 ; par9 = 0 ;
Parameters (R input):
par1 = FALSE ; par2 = 1 ; par3 = 0 ; par4 = 1 ; par5 = 12 ; par6 = 1 ; par7 = 0 ; par8 = 2 ; par9 = 0 ;
R code (references can be found in the software module):
library(lattice)
if (par1 == 'TRUE') par1 <- TRUE
if (par1 == 'FALSE') par1 <- FALSE
par2 <- as.numeric(par2) #Box-Cox lambda transformation parameter
par3 <- as.numeric(par3) #degree of non-seasonal differencing
par4 <- as.numeric(par4) #degree of seasonal differencing
par5 <- as.numeric(par5) #seasonal period
par6 <- as.numeric(par6) #degree (p) of the non-seasonal AR(p) polynomial
par7 <- as.numeric(par7) #degree (q) of the non-seasonal MA(q) polynomial
par8 <- as.numeric(par8) #degree (P) of the seasonal AR(P) polynomial
par9 <- as.numeric(par9) #degree (Q) of the seasonal MA(Q) polynomial
armaGR <- function(arima.out, names, n){
try1 <- arima.out$coef
try2 <- sqrt(diag(arima.out$var.coef))
try.data.frame <- data.frame(matrix(NA,ncol=4,nrow=length(names)))
dimnames(try.data.frame) <- list(names,c('coef','std','tstat','pv'))
try.data.frame[,1] <- try1
for(i in 1:length(try2)) try.data.frame[which(rownames(try.data.frame)==names(try2)[i]),2] <- try2[i]
try.data.frame[,3] <- try.data.frame[,1] / try.data.frame[,2]
try.data.frame[,4] <- round((1-pt(abs(try.data.frame[,3]),df=n-(length(try2)+1)))*2,5)
vector <- rep(NA,length(names))
vector[is.na(try.data.frame[,4])] <- 0
maxi <- which.max(try.data.frame[,4])
continue <- max(try.data.frame[,4],na.rm=TRUE) > .05
vector[maxi] <- 0
list(summary=try.data.frame,next.vector=vector,continue=continue)
}
arimaSelect <- function(series, order=c(13,0,0), seasonal=list(order=c(2,0,0),period=12), include.mean=F){
nrc <- order[1]+order[3]+seasonal$order[1]+seasonal$order[3]
coeff <- matrix(NA, nrow=nrc*2, ncol=nrc)
pval <- matrix(NA, nrow=nrc*2, ncol=nrc)
mylist <- rep(list(NULL), nrc)
names <- NULL
if(order[1] > 0) names <- paste('ar',1:order[1],sep='')
if(order[3] > 0) names <- c( names , paste('ma',1:order[3],sep='') )
if(seasonal$order[1] > 0) names <- c(names, paste('sar',1:seasonal$order[1],sep=''))
if(seasonal$order[3] > 0) names <- c(names, paste('sma',1:seasonal$order[3],sep=''))
arima.out <- arima(series, order=order, seasonal=seasonal, include.mean=include.mean, method='ML')
mylist[[1]] <- arima.out
last.arma <- armaGR(arima.out, names, length(series))
mystop <- FALSE
i <- 1
coeff[i,] <- last.arma[[1]][,1]
pval [i,] <- last.arma[[1]][,4]
i <- 2
aic <- arima.out$aic
while(!mystop){
mylist[[i]] <- arima.out
arima.out <- arima(series, order=order, seasonal=seasonal, include.mean=include.mean, method='ML', fixed=last.arma$next.vector)
aic <- c(aic, arima.out$aic)
last.arma <- armaGR(arima.out, names, length(series))
mystop <- !last.arma$continue
coeff[i,] <- last.arma[[1]][,1]
pval [i,] <- last.arma[[1]][,4]
i <- i+1
}
list(coeff, pval, mylist, aic=aic)
}
arimaSelectplot <- function(arimaSelect.out,noms,choix){
noms <- names(arimaSelect.out[[3]][[1]]$coef)
coeff <- arimaSelect.out[[1]]
k <- min(which(is.na(coeff[,1])))-1
coeff <- coeff[1:k,]
pval <- arimaSelect.out[[2]][1:k,]
aic <- arimaSelect.out$aic[1:k]
coeff[coeff==0] <- NA
n <- ncol(coeff)
if(missing(choix)) choix <- k
layout(matrix(c(1,1,1,2,
3,3,3,2,
3,3,3,4,
5,6,7,7),nr=4),
widths=c(10,35,45,15),
heights=c(30,30,15,15))
couleurs <- rainbow(75)[1:50]#(50)
ticks <- pretty(coeff)
par(mar=c(1,1,3,1))
plot(aic,k:1-.5,type='o',pch=21,bg='blue',cex=2,axes=F,lty=2,xpd=NA)
points(aic[choix],k-choix+.5,pch=21,cex=4,bg=2,xpd=NA)
title('aic',line=2)
par(mar=c(3,0,0,0))
plot(0,axes=F,xlab='',ylab='',xlim=range(ticks),ylim=c(.1,1))
rect(xleft = min(ticks) + (0:49)/50*(max(ticks)-min(ticks)),
xright = min(ticks) + (1:50)/50*(max(ticks)-min(ticks)),
ytop = rep(1,50),
ybottom= rep(0,50),col=couleurs,border=NA)
axis(1,ticks)
rect(xleft=min(ticks),xright=max(ticks),ytop=1,ybottom=0)
text(mean(coeff,na.rm=T),.5,'coefficients',cex=2,font=2)
par(mar=c(1,1,3,1))
image(1:n,1:k,t(coeff[k:1,]),axes=F,col=couleurs,zlim=range(ticks))
for(i in 1:n) for(j in 1:k) if(!is.na(coeff[j,i])) {
if(pval[j,i]<.01) symb = 'green'
else if( (pval[j,i]<.05) & (pval[j,i]>=.01)) symb = 'orange'
else if( (pval[j,i]<.1) & (pval[j,i]>=.05)) symb = 'red'
else symb = 'black'
polygon(c(i+.5 ,i+.2 ,i+.5 ,i+.5),
c(k-j+0.5,k-j+0.5,k-j+0.8,k-j+0.5),
col=symb)
if(j==choix) {
rect(xleft=i-.5,
xright=i+.5,
ybottom=k-j+1.5,
ytop=k-j+.5,
lwd=4)
text(i,
k-j+1,
round(coeff[j,i],2),
cex=1.2,
font=2)
}
else{
rect(xleft=i-.5,xright=i+.5,ybottom=k-j+1.5,ytop=k-j+.5)
text(i,k-j+1,round(coeff[j,i],2),cex=1.2,font=1)
}
}
axis(3,1:n,noms)
par(mar=c(0.5,0,0,0.5))
plot(0,axes=F,xlab='',ylab='',type='n',xlim=c(0,8),ylim=c(-.2,.8))
cols <- c('green','orange','red','black')
niv <- c('0','0.01','0.05','0.1')
for(i in 0:3){
polygon(c(1+2*i ,1+2*i ,1+2*i-.5 ,1+2*i),
c(.4 ,.7 , .4 , .4),
col=cols[i+1])
text(2*i,0.5,niv[i+1],cex=1.5)
}
text(8,.5,1,cex=1.5)
text(4,0,'p-value',cex=2)
box()
residus <- arimaSelect.out[[3]][[choix]]$res
par(mar=c(1,2,4,1))
acf(residus,main='')
title('acf',line=.5)
par(mar=c(1,2,4,1))
pacf(residus,main='')
title('pacf',line=.5)
par(mar=c(2,2,4,1))
qqnorm(residus,main='')
title('qq-norm',line=.5)
qqline(residus)
residus
}
if (par2 == 0) x <- log(x)
if (par2 != 0) x <- x^par2
(selection <- arimaSelect(x, order=c(par6,par3,par7), seasonal=list(order=c(par8,par4,par9), period=par5)))
bitmap(file='test1.png')
resid <- arimaSelectplot(selection)
dev.off()
resid
bitmap(file='test2.png')
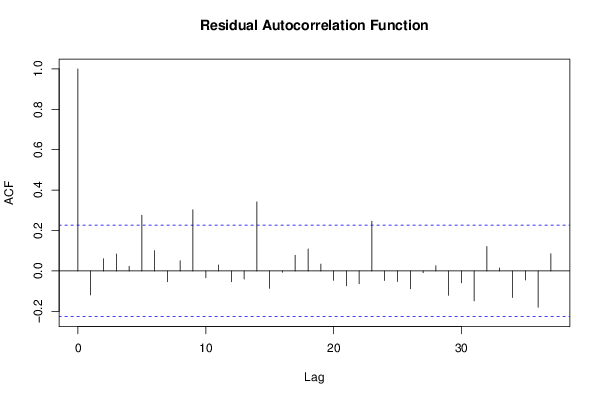
acf(resid,length(resid)/2, main='Residual Autocorrelation Function')
dev.off()
bitmap(file='test3.png')
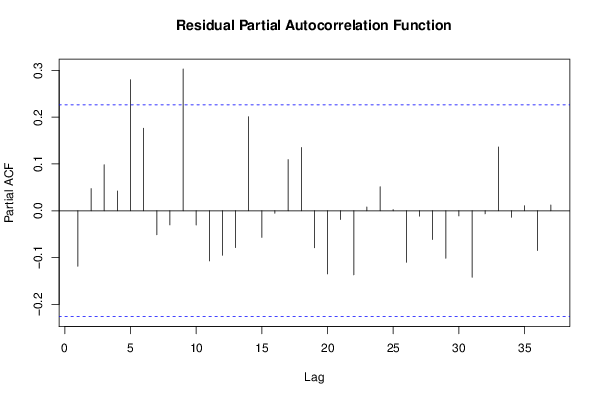
pacf(resid,length(resid)/2, main='Residual Partial Autocorrelation Function')
dev.off()
bitmap(file='test4.png')
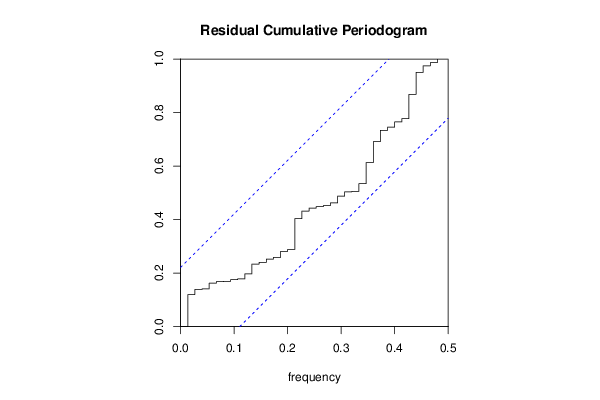
cpgram(resid, main='Residual Cumulative Periodogram')
dev.off()
bitmap(file='test5.png')
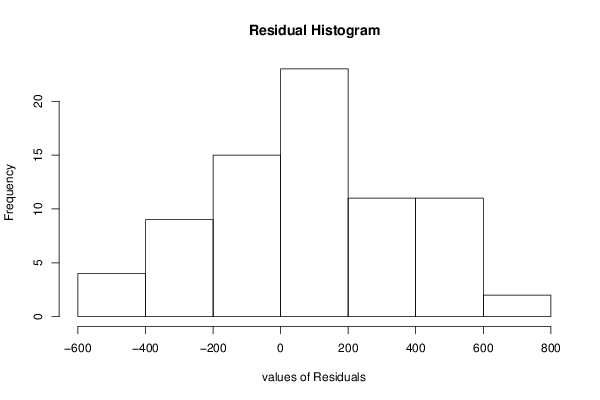
hist(resid, main='Residual Histogram', xlab='values of Residuals')
dev.off()
bitmap(file='test6.png')
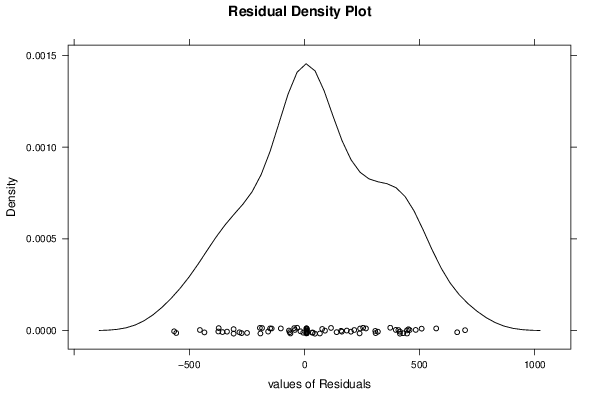
densityplot(~resid,col='black',main='Residual Density Plot', xlab='values of Residuals')
dev.off()
bitmap(file='test7.png')
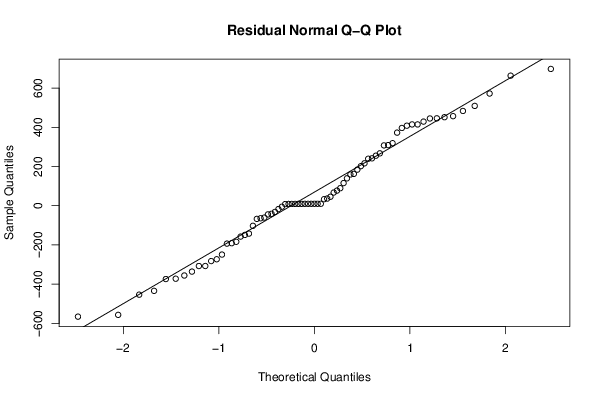
qqnorm(resid, main='Residual Normal Q-Q Plot')
qqline(resid)
dev.off()
ncols <- length(selection[[1]][1,])
nrows <- length(selection[[2]][,1])-1
load(file='createtable')
a<-table.start()
a<-table.row.start(a)
a<-table.element(a,'ARIMA Parameter Estimation and Backward Selection', ncols+1,TRUE)
a<-table.row.end(a)
a<-table.row.start(a)
a<-table.element(a,'Iteration', header=TRUE)
for (i in 1:ncols) {
a<-table.element(a,names(selection[[3]][[1]]$coef)[i],header=TRUE)
}
a<-table.row.end(a)
for (j in 1:nrows) {
a<-table.row.start(a)
mydum <- 'Estimates ('
mydum <- paste(mydum,j)
mydum <- paste(mydum,')')
a<-table.element(a,mydum, header=TRUE)
for (i in 1:ncols) {
a<-table.element(a,round(selection[[1]][j,i],4))
}
a<-table.row.end(a)
a<-table.row.start(a)
a<-table.element(a,'(p-val)', header=TRUE)
for (i in 1:ncols) {
mydum <- '('
mydum <- paste(mydum,round(selection[[2]][j,i],4),sep='')
mydum <- paste(mydum,')')
a<-table.element(a,mydum)
}
a<-table.row.end(a)
}
a<-table.end(a)
table.save(a,file='mytable.tab')
a<-table.start()
a<-table.row.start(a)
a<-table.element(a,'Estimated ARIMA Residuals', 1,TRUE)
a<-table.row.end(a)
a<-table.row.start(a)
a<-table.element(a,'Value', 1,TRUE)
a<-table.row.end(a)
for (i in (par4*par5+par3):length(resid)) {
a<-table.row.start(a)
a<-table.element(a,resid[i])
a<-table.row.end(a)
}
a<-table.end(a)
table.save(a,file='mytable1.tab')