Free Statistics

of Irreproducible Research!

Author's title

Author*The author of this computation has been verified*
R Software Modulerwasp_smp.wasp
Title produced by softwareStandard Deviation-Mean Plot
Date of computationThu, 12 Dec 2013 03:45:35 -0500
Cite this page as followsStatistical Computations at FreeStatistics.org, Office for Research Development and Education, URL https://freestatistics.org/blog/index.php?v=date/2013/Dec/12/t13868379621hef552ave9kw17.htm/, Retrieved Fri, 19 Apr 2024 04:00:03 +0000
Statistical Computations at FreeStatistics.org, Office for Research Development and Education, URL https://freestatistics.org/blog/index.php?pk=232219, Retrieved Fri, 19 Apr 2024 04:00:03 +0000
QR Codes:

Original text written by user:
IsPrivate?No (this computation is public)
User-defined keywords
Estimated Impact125
Family? (F = Feedback message, R = changed R code, M = changed R Module, P = changed Parameters, D = changed Data)
-       [Standard Deviation-Mean Plot] [] [2013-12-12 08:45:35] [9e6a405f514733ea23d87e4507d39d29] [Current]
Feedback Forum

Post a new message
Dataseries X:
164
96
73
49
39
59
169
169
210
278
298
245
200
188
90
79
78
91
167
169
289
247
275
203
223
104
107
85
75
99
135
211
335
488
326
346
261
224
141
148
145
223
272
445
560
612
467
404
518
404
300
210
196
186
247
343
464
680
711
610
513
292
273
322
189
257
324
404
677
858
895
664
628
308
324
248
272


Summary of computational transaction
Raw Inputview raw input (R code)
Raw Outputview raw output of R engine
Computing time9 seconds
R Server'Sir Ronald Aylmer Fisher' @ fisher.wessa.net

\begin{tabular}{lllllllll}
\hline
Summary of computational transaction \tabularnewline
Raw Input & view raw input (R code)  \tabularnewline
Raw Output & view raw output of R engine  \tabularnewline
Computing time & 9 seconds \tabularnewline
R Server & 'Sir Ronald Aylmer Fisher' @ fisher.wessa.net \tabularnewline
\hline
\end{tabular}
%Source: https://freestatistics.org/blog/index.php?pk=232219&T=0

[TABLE]
[ROW][C]Summary of computational transaction[/C][/ROW]
[ROW][C]Raw Input[/C][C]view raw input (R code) [/C][/ROW]
[ROW][C]Raw Output[/C][C]view raw output of R engine [/C][/ROW]
[ROW][C]Computing time[/C][C]9 seconds[/C][/ROW]
[ROW][C]R Server[/C][C]'Sir Ronald Aylmer Fisher' @ fisher.wessa.net[/C][/ROW]
[/TABLE]
Source: https://freestatistics.org/blog/index.php?pk=232219&T=0

Globally Unique Identifier (entire table): ba.freestatistics.org/blog/index.php?pk=232219&T=0

As an alternative you can also use a QR Code:  

The GUIDs for individual cells are displayed in the table below:

Summary of computational transaction
Raw Inputview raw input (R code)
Raw Outputview raw output of R engine
Computing time9 seconds
R Server'Sir Ronald Aylmer Fisher' @ fisher.wessa.net


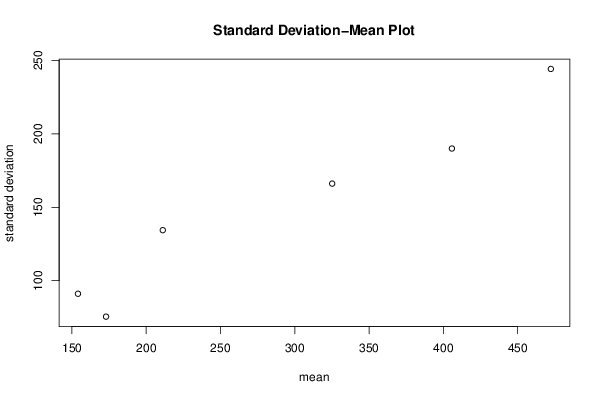
Standard Deviation-Mean Plot
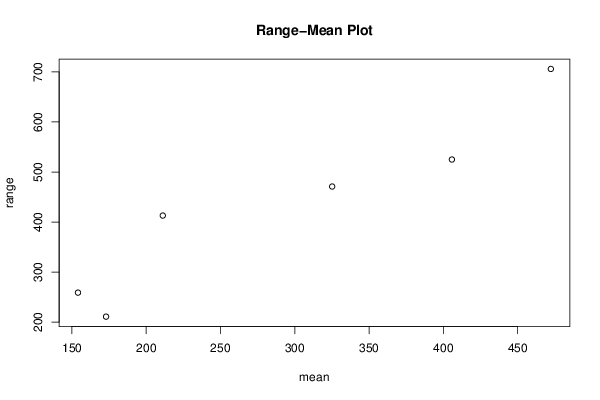
SectionMeanStandard DeviationRange
1154.08333333333391.0938161091813259
217375.5079767008397211
3211.166666666667134.386033726002413
4325.166666666667166.10338146267471
5405.75189.983312664321525
6472.333333333333244.175173085871706

\begin{tabular}{lllllllll}
\hline
Standard Deviation-Mean Plot \tabularnewline
Section & Mean & Standard Deviation & Range \tabularnewline
1 & 154.083333333333 & 91.0938161091813 & 259 \tabularnewline
2 & 173 & 75.5079767008397 & 211 \tabularnewline
3 & 211.166666666667 & 134.386033726002 & 413 \tabularnewline
4 & 325.166666666667 & 166.10338146267 & 471 \tabularnewline
5 & 405.75 & 189.983312664321 & 525 \tabularnewline
6 & 472.333333333333 & 244.175173085871 & 706 \tabularnewline
\hline
\end{tabular}
%Source: https://freestatistics.org/blog/index.php?pk=232219&T=1

[TABLE]
[ROW][C]Standard Deviation-Mean Plot[/C][/ROW]
[ROW][C]Section[/C][C]Mean[/C][C]Standard Deviation[/C][C]Range[/C][/ROW]
[ROW][C]1[/C][C]154.083333333333[/C][C]91.0938161091813[/C][C]259[/C][/ROW]
[ROW][C]2[/C][C]173[/C][C]75.5079767008397[/C][C]211[/C][/ROW]
[ROW][C]3[/C][C]211.166666666667[/C][C]134.386033726002[/C][C]413[/C][/ROW]
[ROW][C]4[/C][C]325.166666666667[/C][C]166.10338146267[/C][C]471[/C][/ROW]
[ROW][C]5[/C][C]405.75[/C][C]189.983312664321[/C][C]525[/C][/ROW]
[ROW][C]6[/C][C]472.333333333333[/C][C]244.175173085871[/C][C]706[/C][/ROW]
[/TABLE]
Source: https://freestatistics.org/blog/index.php?pk=232219&T=1

Globally Unique Identifier (entire table): ba.freestatistics.org/blog/index.php?pk=232219&T=1

As an alternative you can also use a QR Code:  

The GUIDs for individual cells are displayed in the table below:

Standard Deviation-Mean Plot
SectionMeanStandard DeviationRange
1154.08333333333391.0938161091813259
217375.5079767008397211
3211.166666666667134.386033726002413
4325.166666666667166.10338146267471
5405.75189.983312664321525
6472.333333333333244.175173085871706


Regression: S.E.(k) = alpha + beta * Mean(k)
alpha14.5397976742765
beta0.467419412979171
S.D.0.0575820724704363
T-STAT8.11744685325719
p-value0.00125245910781976

\begin{tabular}{lllllllll}
\hline
Regression: S.E.(k) = alpha + beta * Mean(k) \tabularnewline
alpha & 14.5397976742765 \tabularnewline
beta & 0.467419412979171 \tabularnewline
S.D. & 0.0575820724704363 \tabularnewline
T-STAT & 8.11744685325719 \tabularnewline
p-value & 0.00125245910781976 \tabularnewline
\hline
\end{tabular}
%Source: https://freestatistics.org/blog/index.php?pk=232219&T=2

[TABLE]
[ROW][C]Regression: S.E.(k) = alpha + beta * Mean(k)[/C][/ROW]
[ROW][C]alpha[/C][C]14.5397976742765[/C][/ROW]
[ROW][C]beta[/C][C]0.467419412979171[/C][/ROW]
[ROW][C]S.D.[/C][C]0.0575820724704363[/C][/ROW]
[ROW][C]T-STAT[/C][C]8.11744685325719[/C][/ROW]
[ROW][C]p-value[/C][C]0.00125245910781976[/C][/ROW]
[/TABLE]
Source: https://freestatistics.org/blog/index.php?pk=232219&T=2

Globally Unique Identifier (entire table): ba.freestatistics.org/blog/index.php?pk=232219&T=2

As an alternative you can also use a QR Code:  

The GUIDs for individual cells are displayed in the table below:

Regression: S.E.(k) = alpha + beta * Mean(k)
alpha14.5397976742765
beta0.467419412979171
S.D.0.0575820724704363
T-STAT8.11744685325719
p-value0.00125245910781976


Regression: ln S.E.(k) = alpha + beta * ln Mean(k)
alpha-0.173310718003944
beta0.914692457228613
S.D.0.145035687678005
T-STAT6.30667163284206
p-value0.0032318403537262
Lambda0.0853075427713865

\begin{tabular}{lllllllll}
\hline
Regression: ln S.E.(k) = alpha + beta * ln Mean(k) \tabularnewline
alpha & -0.173310718003944 \tabularnewline
beta & 0.914692457228613 \tabularnewline
S.D. & 0.145035687678005 \tabularnewline
T-STAT & 6.30667163284206 \tabularnewline
p-value & 0.0032318403537262 \tabularnewline
Lambda & 0.0853075427713865 \tabularnewline
\hline
\end{tabular}
%Source: https://freestatistics.org/blog/index.php?pk=232219&T=3

[TABLE]
[ROW][C]Regression: ln S.E.(k) = alpha + beta * ln Mean(k)[/C][/ROW]
[ROW][C]alpha[/C][C]-0.173310718003944[/C][/ROW]
[ROW][C]beta[/C][C]0.914692457228613[/C][/ROW]
[ROW][C]S.D.[/C][C]0.145035687678005[/C][/ROW]
[ROW][C]T-STAT[/C][C]6.30667163284206[/C][/ROW]
[ROW][C]p-value[/C][C]0.0032318403537262[/C][/ROW]
[ROW][C]Lambda[/C][C]0.0853075427713865[/C][/ROW]
[/TABLE]
Source: https://freestatistics.org/blog/index.php?pk=232219&T=3

Globally Unique Identifier (entire table): ba.freestatistics.org/blog/index.php?pk=232219&T=3

As an alternative you can also use a QR Code:  

The GUIDs for individual cells are displayed in the table below:

Regression: ln S.E.(k) = alpha + beta * ln Mean(k)
alpha-0.173310718003944
beta0.914692457228613
S.D.0.145035687678005
T-STAT6.30667163284206
p-value0.0032318403537262
Lambda0.0853075427713865


Parameters (Session):
par1 = 12 ;
Parameters (R input):
par1 = 12 ;
R code (references can be found in the software module):
par1 <- as.numeric(par1)
(n <- length(x))
(np <- floor(n / par1))
arr <- array(NA,dim=c(par1,np))
j <- 0
k <- 1
for (i in 1:(np*par1))
{
j = j + 1
arr[j,k] <- x[i]
if (j == par1) {
j = 0
k=k+1
}
}
arr
arr.mean <- array(NA,dim=np)
arr.sd <- array(NA,dim=np)
arr.range <- array(NA,dim=np)
for (j in 1:np)
{
arr.mean[j] <- mean(arr[,j],na.rm=TRUE)
arr.sd[j] <- sd(arr[,j],na.rm=TRUE)
arr.range[j] <- max(arr[,j],na.rm=TRUE) - min(arr[,j],na.rm=TRUE)
}
arr.mean
arr.sd
arr.range
(lm1 <- lm(arr.sd~arr.mean))
(lnlm1 <- lm(log(arr.sd)~log(arr.mean)))
(lm2 <- lm(arr.range~arr.mean))
bitmap(file='test1.png')
plot(arr.mean,arr.sd,main='Standard Deviation-Mean Plot',xlab='mean',ylab='standard deviation')
dev.off()
bitmap(file='test2.png')
plot(arr.mean,arr.range,main='Range-Mean Plot',xlab='mean',ylab='range')
dev.off()
load(file='createtable')
a<-table.start()
a<-table.row.start(a)
a<-table.element(a,'Standard Deviation-Mean Plot',4,TRUE)
a<-table.row.end(a)
a<-table.row.start(a)
a<-table.element(a,'Section',header=TRUE)
a<-table.element(a,'Mean',header=TRUE)
a<-table.element(a,'Standard Deviation',header=TRUE)
a<-table.element(a,'Range',header=TRUE)
a<-table.row.end(a)
for (j in 1:np) {
a<-table.row.start(a)
a<-table.element(a,j,header=TRUE)
a<-table.element(a,arr.mean[j])
a<-table.element(a,arr.sd[j] )
a<-table.element(a,arr.range[j] )
a<-table.row.end(a)
}
a<-table.end(a)
table.save(a,file='mytable.tab')
a<-table.start()
a<-table.row.start(a)
a<-table.element(a,'Regression: S.E.(k) = alpha + beta * Mean(k)',2,TRUE)
a<-table.row.end(a)
a<-table.row.start(a)
a<-table.element(a,'alpha',header=TRUE)
a<-table.element(a,lm1$coefficients[[1]])
a<-table.row.end(a)
a<-table.row.start(a)
a<-table.element(a,'beta',header=TRUE)
a<-table.element(a,lm1$coefficients[[2]])
a<-table.row.end(a)
a<-table.row.start(a)
a<-table.element(a,'S.D.',header=TRUE)
a<-table.element(a,summary(lm1)$coefficients[2,2])
a<-table.row.end(a)
a<-table.row.start(a)
a<-table.element(a,'T-STAT',header=TRUE)
a<-table.element(a,summary(lm1)$coefficients[2,3])
a<-table.row.end(a)
a<-table.row.start(a)
a<-table.element(a,'p-value',header=TRUE)
a<-table.element(a,summary(lm1)$coefficients[2,4])
a<-table.row.end(a)
a<-table.end(a)
table.save(a,file='mytable1.tab')
a<-table.start()
a<-table.row.start(a)
a<-table.element(a,'Regression: ln S.E.(k) = alpha + beta * ln Mean(k)',2,TRUE)
a<-table.row.end(a)
a<-table.row.start(a)
a<-table.element(a,'alpha',header=TRUE)
a<-table.element(a,lnlm1$coefficients[[1]])
a<-table.row.end(a)
a<-table.row.start(a)
a<-table.element(a,'beta',header=TRUE)
a<-table.element(a,lnlm1$coefficients[[2]])
a<-table.row.end(a)
a<-table.row.start(a)
a<-table.element(a,'S.D.',header=TRUE)
a<-table.element(a,summary(lnlm1)$coefficients[2,2])
a<-table.row.end(a)
a<-table.row.start(a)
a<-table.element(a,'T-STAT',header=TRUE)
a<-table.element(a,summary(lnlm1)$coefficients[2,3])
a<-table.row.end(a)
a<-table.row.start(a)
a<-table.element(a,'p-value',header=TRUE)
a<-table.element(a,summary(lnlm1)$coefficients[2,4])
a<-table.row.end(a)
a<-table.row.start(a)
a<-table.element(a,'Lambda',header=TRUE)
a<-table.element(a,1-lnlm1$coefficients[[2]])
a<-table.row.end(a)
a<-table.end(a)
table.save(a,file='mytable2.tab')