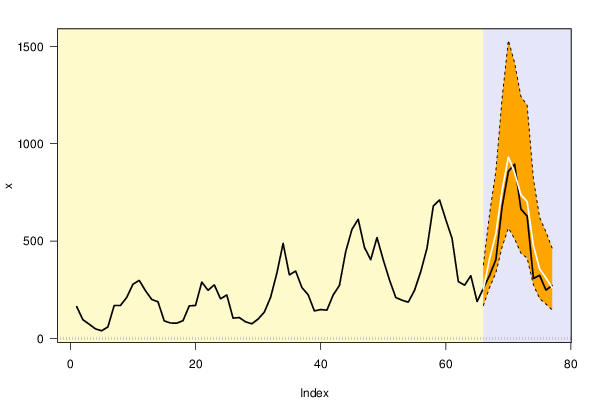
| Univariate ARIMA Extrapolation Forecast | ||||||||
| time | Y[t] | F[t] | 95% LB | 95% UB | p-value (H0: Y[t] = F[t]) | P(F[t]>Y[t-1]) | P(F[t]>Y[t-s]) | P(F[t]>Y[65]) |
| 53 | 196 | - | - | - | - | - | - | - |
| 54 | 186 | - | - | - | - | - | - | - |
| 55 | 247 | - | - | - | - | - | - | - |
| 56 | 343 | - | - | - | - | - | - | - |
| 57 | 464 | - | - | - | - | - | - | - |
| 58 | 680 | - | - | - | - | - | - | - |
| 59 | 711 | - | - | - | - | - | - | - |
| 60 | 610 | - | - | - | - | - | - | - |
| 61 | 513 | - | - | - | - | - | - | - |
| 62 | 292 | - | - | - | - | - | - | - |
| 63 | 273 | - | - | - | - | - | - | - |
| 64 | 322 | - | - | - | - | - | - | - |
| 65 | 189 | - | - | - | - | - | - | - |
| 66 | 257 | 252.1072 | 168.6425 | 376.8803 | 0.4694 | 0.8392 | 0.8505 | 0.8392 |
| 67 | 324 | 409.6421 | 261.8088 | 640.9511 | 0.234 | 0.9021 | 0.9159 | 0.9692 |
| 68 | 404 | 537.7032 | 336.6974 | 858.708 | 0.2071 | 0.904 | 0.8827 | 0.9834 |
| 69 | 677 | 761.3215 | 469.6354 | 1234.171 | 0.3633 | 0.9307 | 0.8911 | 0.9912 |
| 70 | 858 | 931.5542 | 567.0283 | 1530.4233 | 0.4049 | 0.7976 | 0.7948 | 0.9925 |
| 71 | 895 | 850.2124 | 510.9704 | 1414.6829 | 0.4382 | 0.4892 | 0.6856 | 0.9892 |
| 72 | 664 | 737.742 | 437.8905 | 1242.9208 | 0.3874 | 0.2709 | 0.6899 | 0.9834 |
| 73 | 628 | 702.2996 | 412.088 | 1196.8918 | 0.3842 | 0.5603 | 0.7734 | 0.979 |
| 74 | 308 | 475.4009 | 275.783 | 819.5066 | 0.1702 | 0.1924 | 0.8519 | 0.9486 |
| 75 | 324 | 355.9765 | 204.2075 | 620.5417 | 0.4064 | 0.6389 | 0.7306 | 0.892 |
| 76 | 248 | 310.6836 | 176.2819 | 547.5565 | 0.302 | 0.4561 | 0.4627 | 0.843 |
| 77 | 272 | 259.9173 | 145.8996 | 463.0378 | 0.4536 | 0.5458 | 0.7531 | 0.7531 |
| Univariate ARIMA Extrapolation Forecast Performance | |||||||||
| time | % S.E. | PE | MAPE | sMAPE | Sq.E | MSE | RMSE | ScaledE | MASE |
| 66 | 0.2525 | 0.019 | 0.019 | 0.0192 | 23.9395 | 0 | 0 | 0.0401 | 0.0401 |
| 67 | 0.2881 | -0.2643 | 0.1417 | 0.1263 | 7334.5676 | 3679.2535 | 60.6569 | -0.7025 | 0.3713 |
| 68 | 0.3046 | -0.3309 | 0.2048 | 0.1789 | 17876.5523 | 8411.6865 | 91.7152 | -1.0967 | 0.6131 |
| 69 | 0.3169 | -0.1246 | 0.1847 | 0.1635 | 7110.1137 | 8086.2933 | 89.9238 | -0.6917 | 0.6328 |
| 70 | 0.328 | -0.0857 | 0.1649 | 0.1472 | 5410.2257 | 7551.0798 | 86.8969 | -0.6034 | 0.6269 |
| 71 | 0.3387 | 0.05 | 0.1458 | 0.1312 | 2005.9292 | 6626.888 | 81.4057 | 0.3674 | 0.5836 |
| 72 | 0.3494 | -0.1111 | 0.1408 | 0.1275 | 5437.8829 | 6457.0301 | 80.3556 | -0.6049 | 0.5867 |
| 73 | 0.3593 | -0.1183 | 0.138 | 0.1255 | 5520.4358 | 6339.9558 | 79.6238 | -0.6095 | 0.5895 |
| 74 | 0.3693 | -0.5435 | 0.1831 | 0.1591 | 28023.0617 | 8749.1898 | 93.5371 | -1.3732 | 0.6766 |
| 75 | 0.3792 | -0.0987 | 0.1746 | 0.1526 | 1022.4982 | 7976.5207 | 89.3114 | -0.2623 | 0.6352 |
| 76 | 0.389 | -0.2528 | 0.1817 | 0.1591 | 3929.2298 | 7608.5851 | 87.2272 | -0.5142 | 0.6242 |
| 77 | 0.3987 | 0.0444 | 0.1703 | 0.1496 | 145.9912 | 6986.7023 | 83.5865 | 0.0991 | 0.5804 |