Free Statistics

of Irreproducible Research!

Author's title

Author*Unverified author*
R Software Modulerwasp_autocorrelation.wasp
Title produced by software(Partial) Autocorrelation Function
Date of computationSat, 14 Dec 2013 06:30:45 -0500
Cite this page as followsStatistical Computations at FreeStatistics.org, Office for Research Development and Education, URL https://freestatistics.org/blog/index.php?v=date/2013/Dec/14/t1387020680f6zcz1ks9hl8omd.htm/, Retrieved Fri, 19 Apr 2024 06:34:47 +0000
Statistical Computations at FreeStatistics.org, Office for Research Development and Education, URL https://freestatistics.org/blog/index.php?pk=232314, Retrieved Fri, 19 Apr 2024 06:34:47 +0000
QR Codes:

Original text written by user:
IsPrivate?No (this computation is public)
User-defined keywords
Estimated Impact188
Family? (F = Feedback message, R = changed R code, M = changed R Module, P = changed Parameters, D = changed Data)
-     [Mean Plot] [] [2013-10-16 10:19:37] [08d009098002cb6f4cea01adb17dbd84]
-   PD  [Mean Plot] [] [2013-12-14 11:02:38] [0b3be05215961a0fa3a77d7bd3c5f728]
- RMP     [(Partial) Autocorrelation Function] [] [2013-12-14 11:27:28] [0b3be05215961a0fa3a77d7bd3c5f728]
- R PD        [(Partial) Autocorrelation Function] [] [2013-12-14 11:30:45] [998078bdc1a977f0c7d195eebcf8b96b] [Current]
Feedback Forum

Post a new message
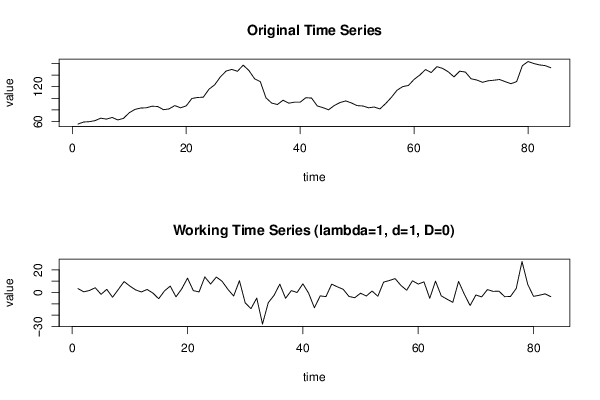
Dataseries X:
55.7
59.2
59.8
61.6
65.8
64.2
67
62.8
65.5
75.2
80.9
83.2
83.7
86.4
85.9
80.4
81.8
87.5
83.7
87
99.7
101.4
101.9
115.7
123.2
136.9
146.8
149.6
146.5
157
147.9
133.6
128.7
100.8
91.8
89.3
96.7
91.6
93.3
93.3
101
100.4
86.9
83.9
80.3
87.7
92.7
95.5
92
87.4
86.8
83.7
85
81.7
90.9
101.5
113.8
120.1
122.1
132.5
140
149.4
144.3
154.4
151.4
145.5
136.8
146.6
145.1
133.6
131.4
127.5
130.1
131.1
132.3
128.6
125.1
128.7
156.1
163.2
159.8
157.4
156.2
152.5


Summary of computational transaction
Raw Inputview raw input (R code)
Raw Outputview raw output of R engine
Computing time4 seconds
R Server'George Udny Yule' @ yule.wessa.net

\begin{tabular}{lllllllll}
\hline
Summary of computational transaction \tabularnewline
Raw Input & view raw input (R code)  \tabularnewline
Raw Output & view raw output of R engine  \tabularnewline
Computing time & 4 seconds \tabularnewline
R Server & 'George Udny Yule' @ yule.wessa.net \tabularnewline
\hline
\end{tabular}
%Source: https://freestatistics.org/blog/index.php?pk=232314&T=0

[TABLE]
[ROW][C]Summary of computational transaction[/C][/ROW]
[ROW][C]Raw Input[/C][C]view raw input (R code) [/C][/ROW]
[ROW][C]Raw Output[/C][C]view raw output of R engine [/C][/ROW]
[ROW][C]Computing time[/C][C]4 seconds[/C][/ROW]
[ROW][C]R Server[/C][C]'George Udny Yule' @ yule.wessa.net[/C][/ROW]
[/TABLE]
Source: https://freestatistics.org/blog/index.php?pk=232314&T=0

Globally Unique Identifier (entire table): ba.freestatistics.org/blog/index.php?pk=232314&T=0

As an alternative you can also use a QR Code:  

The GUIDs for individual cells are displayed in the table below:

Summary of computational transaction
Raw Inputview raw input (R code)
Raw Outputview raw output of R engine
Computing time4 seconds
R Server'George Udny Yule' @ yule.wessa.net


Autocorrelation Function
Time lag kACF(k)T-STATP-value
10.3145812.8660.002633
20.1281061.16710.123256
30.0748560.6820.248577
40.0715310.65170.258204
5-0.049854-0.45420.325439
6-0.044161-0.40230.344239
7-0.10033-0.91410.181669
8-0.23586-2.14880.017282
9-0.059983-0.54650.293105
10-0.160203-1.45950.074098
110.0601090.54760.29271
12-0.136778-1.24610.108116
13-0.194654-1.77340.039916
14-0.114886-1.04670.149147
150.0621420.56610.286412
160.0657830.59930.275298
170.0126270.1150.454348
180.0814820.74230.229989
190.015640.14250.443522
200.0500090.45560.324932
21-0.068859-0.62730.266082
22-0.08649-0.7880.216482
23-0.059021-0.53770.296108
24-0.160944-1.46630.073177
25-0.15804-1.43980.076841
26-0.138626-1.26290.105073
27-0.017573-0.16010.436596
28-0.091634-0.83480.203106
29-0.071102-0.64780.259461
30-0.080818-0.73630.231816
310.1170021.06590.14477
320.1545721.40820.081401
330.0851210.77550.220129
340.0954050.86920.193628
350.1031770.940.174977
360.0678950.61860.268953
370.0639520.58260.280861
380.1748561.5930.05748
390.0174610.15910.436997
40-0.026005-0.23690.406654
41-0.037793-0.34430.365741
420.0152950.13930.444758
43-0.007753-0.07060.47193
44-0.073129-0.66620.253553
45-0.220266-2.00670.024018
46-0.097029-0.8840.189631
47-0.043283-0.39430.347177
48-0.045975-0.41890.338203

\begin{tabular}{lllllllll}
\hline
Autocorrelation Function \tabularnewline
Time lag k & ACF(k) & T-STAT & P-value \tabularnewline
1 & 0.314581 & 2.866 & 0.002633 \tabularnewline
2 & 0.128106 & 1.1671 & 0.123256 \tabularnewline
3 & 0.074856 & 0.682 & 0.248577 \tabularnewline
4 & 0.071531 & 0.6517 & 0.258204 \tabularnewline
5 & -0.049854 & -0.4542 & 0.325439 \tabularnewline
6 & -0.044161 & -0.4023 & 0.344239 \tabularnewline
7 & -0.10033 & -0.9141 & 0.181669 \tabularnewline
8 & -0.23586 & -2.1488 & 0.017282 \tabularnewline
9 & -0.059983 & -0.5465 & 0.293105 \tabularnewline
10 & -0.160203 & -1.4595 & 0.074098 \tabularnewline
11 & 0.060109 & 0.5476 & 0.29271 \tabularnewline
12 & -0.136778 & -1.2461 & 0.108116 \tabularnewline
13 & -0.194654 & -1.7734 & 0.039916 \tabularnewline
14 & -0.114886 & -1.0467 & 0.149147 \tabularnewline
15 & 0.062142 & 0.5661 & 0.286412 \tabularnewline
16 & 0.065783 & 0.5993 & 0.275298 \tabularnewline
17 & 0.012627 & 0.115 & 0.454348 \tabularnewline
18 & 0.081482 & 0.7423 & 0.229989 \tabularnewline
19 & 0.01564 & 0.1425 & 0.443522 \tabularnewline
20 & 0.050009 & 0.4556 & 0.324932 \tabularnewline
21 & -0.068859 & -0.6273 & 0.266082 \tabularnewline
22 & -0.08649 & -0.788 & 0.216482 \tabularnewline
23 & -0.059021 & -0.5377 & 0.296108 \tabularnewline
24 & -0.160944 & -1.4663 & 0.073177 \tabularnewline
25 & -0.15804 & -1.4398 & 0.076841 \tabularnewline
26 & -0.138626 & -1.2629 & 0.105073 \tabularnewline
27 & -0.017573 & -0.1601 & 0.436596 \tabularnewline
28 & -0.091634 & -0.8348 & 0.203106 \tabularnewline
29 & -0.071102 & -0.6478 & 0.259461 \tabularnewline
30 & -0.080818 & -0.7363 & 0.231816 \tabularnewline
31 & 0.117002 & 1.0659 & 0.14477 \tabularnewline
32 & 0.154572 & 1.4082 & 0.081401 \tabularnewline
33 & 0.085121 & 0.7755 & 0.220129 \tabularnewline
34 & 0.095405 & 0.8692 & 0.193628 \tabularnewline
35 & 0.103177 & 0.94 & 0.174977 \tabularnewline
36 & 0.067895 & 0.6186 & 0.268953 \tabularnewline
37 & 0.063952 & 0.5826 & 0.280861 \tabularnewline
38 & 0.174856 & 1.593 & 0.05748 \tabularnewline
39 & 0.017461 & 0.1591 & 0.436997 \tabularnewline
40 & -0.026005 & -0.2369 & 0.406654 \tabularnewline
41 & -0.037793 & -0.3443 & 0.365741 \tabularnewline
42 & 0.015295 & 0.1393 & 0.444758 \tabularnewline
43 & -0.007753 & -0.0706 & 0.47193 \tabularnewline
44 & -0.073129 & -0.6662 & 0.253553 \tabularnewline
45 & -0.220266 & -2.0067 & 0.024018 \tabularnewline
46 & -0.097029 & -0.884 & 0.189631 \tabularnewline
47 & -0.043283 & -0.3943 & 0.347177 \tabularnewline
48 & -0.045975 & -0.4189 & 0.338203 \tabularnewline
\hline
\end{tabular}
%Source: https://freestatistics.org/blog/index.php?pk=232314&T=1

[TABLE]
[ROW][C]Autocorrelation Function[/C][/ROW]
[ROW][C]Time lag k[/C][C]ACF(k)[/C][C]T-STAT[/C][C]P-value[/C][/ROW]
[ROW][C]1[/C][C]0.314581[/C][C]2.866[/C][C]0.002633[/C][/ROW]
[ROW][C]2[/C][C]0.128106[/C][C]1.1671[/C][C]0.123256[/C][/ROW]
[ROW][C]3[/C][C]0.074856[/C][C]0.682[/C][C]0.248577[/C][/ROW]
[ROW][C]4[/C][C]0.071531[/C][C]0.6517[/C][C]0.258204[/C][/ROW]
[ROW][C]5[/C][C]-0.049854[/C][C]-0.4542[/C][C]0.325439[/C][/ROW]
[ROW][C]6[/C][C]-0.044161[/C][C]-0.4023[/C][C]0.344239[/C][/ROW]
[ROW][C]7[/C][C]-0.10033[/C][C]-0.9141[/C][C]0.181669[/C][/ROW]
[ROW][C]8[/C][C]-0.23586[/C][C]-2.1488[/C][C]0.017282[/C][/ROW]
[ROW][C]9[/C][C]-0.059983[/C][C]-0.5465[/C][C]0.293105[/C][/ROW]
[ROW][C]10[/C][C]-0.160203[/C][C]-1.4595[/C][C]0.074098[/C][/ROW]
[ROW][C]11[/C][C]0.060109[/C][C]0.5476[/C][C]0.29271[/C][/ROW]
[ROW][C]12[/C][C]-0.136778[/C][C]-1.2461[/C][C]0.108116[/C][/ROW]
[ROW][C]13[/C][C]-0.194654[/C][C]-1.7734[/C][C]0.039916[/C][/ROW]
[ROW][C]14[/C][C]-0.114886[/C][C]-1.0467[/C][C]0.149147[/C][/ROW]
[ROW][C]15[/C][C]0.062142[/C][C]0.5661[/C][C]0.286412[/C][/ROW]
[ROW][C]16[/C][C]0.065783[/C][C]0.5993[/C][C]0.275298[/C][/ROW]
[ROW][C]17[/C][C]0.012627[/C][C]0.115[/C][C]0.454348[/C][/ROW]
[ROW][C]18[/C][C]0.081482[/C][C]0.7423[/C][C]0.229989[/C][/ROW]
[ROW][C]19[/C][C]0.01564[/C][C]0.1425[/C][C]0.443522[/C][/ROW]
[ROW][C]20[/C][C]0.050009[/C][C]0.4556[/C][C]0.324932[/C][/ROW]
[ROW][C]21[/C][C]-0.068859[/C][C]-0.6273[/C][C]0.266082[/C][/ROW]
[ROW][C]22[/C][C]-0.08649[/C][C]-0.788[/C][C]0.216482[/C][/ROW]
[ROW][C]23[/C][C]-0.059021[/C][C]-0.5377[/C][C]0.296108[/C][/ROW]
[ROW][C]24[/C][C]-0.160944[/C][C]-1.4663[/C][C]0.073177[/C][/ROW]
[ROW][C]25[/C][C]-0.15804[/C][C]-1.4398[/C][C]0.076841[/C][/ROW]
[ROW][C]26[/C][C]-0.138626[/C][C]-1.2629[/C][C]0.105073[/C][/ROW]
[ROW][C]27[/C][C]-0.017573[/C][C]-0.1601[/C][C]0.436596[/C][/ROW]
[ROW][C]28[/C][C]-0.091634[/C][C]-0.8348[/C][C]0.203106[/C][/ROW]
[ROW][C]29[/C][C]-0.071102[/C][C]-0.6478[/C][C]0.259461[/C][/ROW]
[ROW][C]30[/C][C]-0.080818[/C][C]-0.7363[/C][C]0.231816[/C][/ROW]
[ROW][C]31[/C][C]0.117002[/C][C]1.0659[/C][C]0.14477[/C][/ROW]
[ROW][C]32[/C][C]0.154572[/C][C]1.4082[/C][C]0.081401[/C][/ROW]
[ROW][C]33[/C][C]0.085121[/C][C]0.7755[/C][C]0.220129[/C][/ROW]
[ROW][C]34[/C][C]0.095405[/C][C]0.8692[/C][C]0.193628[/C][/ROW]
[ROW][C]35[/C][C]0.103177[/C][C]0.94[/C][C]0.174977[/C][/ROW]
[ROW][C]36[/C][C]0.067895[/C][C]0.6186[/C][C]0.268953[/C][/ROW]
[ROW][C]37[/C][C]0.063952[/C][C]0.5826[/C][C]0.280861[/C][/ROW]
[ROW][C]38[/C][C]0.174856[/C][C]1.593[/C][C]0.05748[/C][/ROW]
[ROW][C]39[/C][C]0.017461[/C][C]0.1591[/C][C]0.436997[/C][/ROW]
[ROW][C]40[/C][C]-0.026005[/C][C]-0.2369[/C][C]0.406654[/C][/ROW]
[ROW][C]41[/C][C]-0.037793[/C][C]-0.3443[/C][C]0.365741[/C][/ROW]
[ROW][C]42[/C][C]0.015295[/C][C]0.1393[/C][C]0.444758[/C][/ROW]
[ROW][C]43[/C][C]-0.007753[/C][C]-0.0706[/C][C]0.47193[/C][/ROW]
[ROW][C]44[/C][C]-0.073129[/C][C]-0.6662[/C][C]0.253553[/C][/ROW]
[ROW][C]45[/C][C]-0.220266[/C][C]-2.0067[/C][C]0.024018[/C][/ROW]
[ROW][C]46[/C][C]-0.097029[/C][C]-0.884[/C][C]0.189631[/C][/ROW]
[ROW][C]47[/C][C]-0.043283[/C][C]-0.3943[/C][C]0.347177[/C][/ROW]
[ROW][C]48[/C][C]-0.045975[/C][C]-0.4189[/C][C]0.338203[/C][/ROW]
[/TABLE]
Source: https://freestatistics.org/blog/index.php?pk=232314&T=1

Globally Unique Identifier (entire table): ba.freestatistics.org/blog/index.php?pk=232314&T=1

As an alternative you can also use a QR Code:  

The GUIDs for individual cells are displayed in the table below:

Autocorrelation Function
Time lag kACF(k)T-STATP-value
10.3145812.8660.002633
20.1281061.16710.123256
30.0748560.6820.248577
40.0715310.65170.258204
5-0.049854-0.45420.325439
6-0.044161-0.40230.344239
7-0.10033-0.91410.181669
8-0.23586-2.14880.017282
9-0.059983-0.54650.293105
10-0.160203-1.45950.074098
110.0601090.54760.29271
12-0.136778-1.24610.108116
13-0.194654-1.77340.039916
14-0.114886-1.04670.149147
150.0621420.56610.286412
160.0657830.59930.275298
170.0126270.1150.454348
180.0814820.74230.229989
190.015640.14250.443522
200.0500090.45560.324932
21-0.068859-0.62730.266082
22-0.08649-0.7880.216482
23-0.059021-0.53770.296108
24-0.160944-1.46630.073177
25-0.15804-1.43980.076841
26-0.138626-1.26290.105073
27-0.017573-0.16010.436596
28-0.091634-0.83480.203106
29-0.071102-0.64780.259461
30-0.080818-0.73630.231816
310.1170021.06590.14477
320.1545721.40820.081401
330.0851210.77550.220129
340.0954050.86920.193628
350.1031770.940.174977
360.0678950.61860.268953
370.0639520.58260.280861
380.1748561.5930.05748
390.0174610.15910.436997
40-0.026005-0.23690.406654
41-0.037793-0.34430.365741
420.0152950.13930.444758
43-0.007753-0.07060.47193
44-0.073129-0.66620.253553
45-0.220266-2.00670.024018
46-0.097029-0.8840.189631
47-0.043283-0.39430.347177
48-0.045975-0.41890.338203


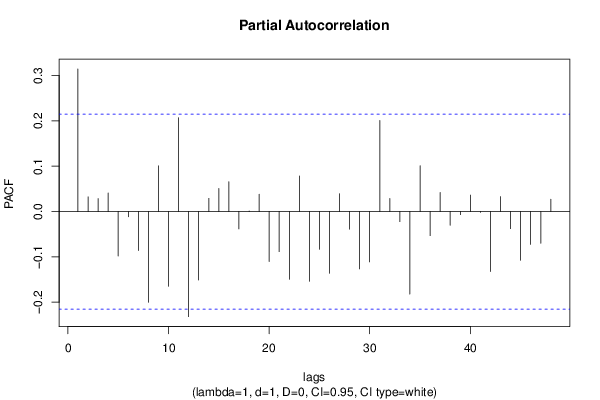
Partial Autocorrelation Function
Time lag kPACF(k)T-STATP-value
10.3145812.8660.002633
20.0323450.29470.384487
30.0285360.260.397764
40.0409250.37280.355109
5-0.09814-0.89410.186927
6-0.011436-0.10420.458636
7-0.086057-0.7840.217631
8-0.19994-1.82150.036064
90.1007350.91770.180707
10-0.16481-1.50150.068511
110.206951.88540.031437
12-0.231857-2.11230.018832
13-0.1511-1.37660.086171
140.0291670.26570.395556
150.0508320.46310.322253
160.0659280.60060.274862
17-0.038279-0.34870.364084
180.0011060.01010.495994
190.0380380.34650.364905
20-0.110193-1.00390.15917
21-0.088376-0.80510.211518
22-0.149228-1.35950.08883
230.0782610.7130.238926
24-0.153612-1.39950.0827
25-0.083338-0.75920.224928
26-0.136169-1.24060.109131
270.0394270.35920.36018
28-0.038856-0.3540.362121
29-0.126526-1.15270.126169
30-0.11104-1.01160.157329
310.2009541.83080.035361
320.0288440.26280.396686
33-0.022227-0.20250.420012
34-0.182117-1.65920.050429
350.1009790.920.180129
36-0.053129-0.4840.314821
370.0420060.38270.351463
38-0.030261-0.27570.391736
39-0.006894-0.06280.475036
400.0363320.3310.370739
41-0.001763-0.01610.493612
42-0.132101-1.20350.116103
430.0329320.30.382455
44-0.037636-0.34290.366279
45-0.107578-0.98010.164947
46-0.072469-0.66020.255468
47-0.069844-0.63630.263163
480.027210.24790.402412

\begin{tabular}{lllllllll}
\hline
Partial Autocorrelation Function \tabularnewline
Time lag k & PACF(k) & T-STAT & P-value \tabularnewline
1 & 0.314581 & 2.866 & 0.002633 \tabularnewline
2 & 0.032345 & 0.2947 & 0.384487 \tabularnewline
3 & 0.028536 & 0.26 & 0.397764 \tabularnewline
4 & 0.040925 & 0.3728 & 0.355109 \tabularnewline
5 & -0.09814 & -0.8941 & 0.186927 \tabularnewline
6 & -0.011436 & -0.1042 & 0.458636 \tabularnewline
7 & -0.086057 & -0.784 & 0.217631 \tabularnewline
8 & -0.19994 & -1.8215 & 0.036064 \tabularnewline
9 & 0.100735 & 0.9177 & 0.180707 \tabularnewline
10 & -0.16481 & -1.5015 & 0.068511 \tabularnewline
11 & 0.20695 & 1.8854 & 0.031437 \tabularnewline
12 & -0.231857 & -2.1123 & 0.018832 \tabularnewline
13 & -0.1511 & -1.3766 & 0.086171 \tabularnewline
14 & 0.029167 & 0.2657 & 0.395556 \tabularnewline
15 & 0.050832 & 0.4631 & 0.322253 \tabularnewline
16 & 0.065928 & 0.6006 & 0.274862 \tabularnewline
17 & -0.038279 & -0.3487 & 0.364084 \tabularnewline
18 & 0.001106 & 0.0101 & 0.495994 \tabularnewline
19 & 0.038038 & 0.3465 & 0.364905 \tabularnewline
20 & -0.110193 & -1.0039 & 0.15917 \tabularnewline
21 & -0.088376 & -0.8051 & 0.211518 \tabularnewline
22 & -0.149228 & -1.3595 & 0.08883 \tabularnewline
23 & 0.078261 & 0.713 & 0.238926 \tabularnewline
24 & -0.153612 & -1.3995 & 0.0827 \tabularnewline
25 & -0.083338 & -0.7592 & 0.224928 \tabularnewline
26 & -0.136169 & -1.2406 & 0.109131 \tabularnewline
27 & 0.039427 & 0.3592 & 0.36018 \tabularnewline
28 & -0.038856 & -0.354 & 0.362121 \tabularnewline
29 & -0.126526 & -1.1527 & 0.126169 \tabularnewline
30 & -0.11104 & -1.0116 & 0.157329 \tabularnewline
31 & 0.200954 & 1.8308 & 0.035361 \tabularnewline
32 & 0.028844 & 0.2628 & 0.396686 \tabularnewline
33 & -0.022227 & -0.2025 & 0.420012 \tabularnewline
34 & -0.182117 & -1.6592 & 0.050429 \tabularnewline
35 & 0.100979 & 0.92 & 0.180129 \tabularnewline
36 & -0.053129 & -0.484 & 0.314821 \tabularnewline
37 & 0.042006 & 0.3827 & 0.351463 \tabularnewline
38 & -0.030261 & -0.2757 & 0.391736 \tabularnewline
39 & -0.006894 & -0.0628 & 0.475036 \tabularnewline
40 & 0.036332 & 0.331 & 0.370739 \tabularnewline
41 & -0.001763 & -0.0161 & 0.493612 \tabularnewline
42 & -0.132101 & -1.2035 & 0.116103 \tabularnewline
43 & 0.032932 & 0.3 & 0.382455 \tabularnewline
44 & -0.037636 & -0.3429 & 0.366279 \tabularnewline
45 & -0.107578 & -0.9801 & 0.164947 \tabularnewline
46 & -0.072469 & -0.6602 & 0.255468 \tabularnewline
47 & -0.069844 & -0.6363 & 0.263163 \tabularnewline
48 & 0.02721 & 0.2479 & 0.402412 \tabularnewline
\hline
\end{tabular}
%Source: https://freestatistics.org/blog/index.php?pk=232314&T=2

[TABLE]
[ROW][C]Partial Autocorrelation Function[/C][/ROW]
[ROW][C]Time lag k[/C][C]PACF(k)[/C][C]T-STAT[/C][C]P-value[/C][/ROW]
[ROW][C]1[/C][C]0.314581[/C][C]2.866[/C][C]0.002633[/C][/ROW]
[ROW][C]2[/C][C]0.032345[/C][C]0.2947[/C][C]0.384487[/C][/ROW]
[ROW][C]3[/C][C]0.028536[/C][C]0.26[/C][C]0.397764[/C][/ROW]
[ROW][C]4[/C][C]0.040925[/C][C]0.3728[/C][C]0.355109[/C][/ROW]
[ROW][C]5[/C][C]-0.09814[/C][C]-0.8941[/C][C]0.186927[/C][/ROW]
[ROW][C]6[/C][C]-0.011436[/C][C]-0.1042[/C][C]0.458636[/C][/ROW]
[ROW][C]7[/C][C]-0.086057[/C][C]-0.784[/C][C]0.217631[/C][/ROW]
[ROW][C]8[/C][C]-0.19994[/C][C]-1.8215[/C][C]0.036064[/C][/ROW]
[ROW][C]9[/C][C]0.100735[/C][C]0.9177[/C][C]0.180707[/C][/ROW]
[ROW][C]10[/C][C]-0.16481[/C][C]-1.5015[/C][C]0.068511[/C][/ROW]
[ROW][C]11[/C][C]0.20695[/C][C]1.8854[/C][C]0.031437[/C][/ROW]
[ROW][C]12[/C][C]-0.231857[/C][C]-2.1123[/C][C]0.018832[/C][/ROW]
[ROW][C]13[/C][C]-0.1511[/C][C]-1.3766[/C][C]0.086171[/C][/ROW]
[ROW][C]14[/C][C]0.029167[/C][C]0.2657[/C][C]0.395556[/C][/ROW]
[ROW][C]15[/C][C]0.050832[/C][C]0.4631[/C][C]0.322253[/C][/ROW]
[ROW][C]16[/C][C]0.065928[/C][C]0.6006[/C][C]0.274862[/C][/ROW]
[ROW][C]17[/C][C]-0.038279[/C][C]-0.3487[/C][C]0.364084[/C][/ROW]
[ROW][C]18[/C][C]0.001106[/C][C]0.0101[/C][C]0.495994[/C][/ROW]
[ROW][C]19[/C][C]0.038038[/C][C]0.3465[/C][C]0.364905[/C][/ROW]
[ROW][C]20[/C][C]-0.110193[/C][C]-1.0039[/C][C]0.15917[/C][/ROW]
[ROW][C]21[/C][C]-0.088376[/C][C]-0.8051[/C][C]0.211518[/C][/ROW]
[ROW][C]22[/C][C]-0.149228[/C][C]-1.3595[/C][C]0.08883[/C][/ROW]
[ROW][C]23[/C][C]0.078261[/C][C]0.713[/C][C]0.238926[/C][/ROW]
[ROW][C]24[/C][C]-0.153612[/C][C]-1.3995[/C][C]0.0827[/C][/ROW]
[ROW][C]25[/C][C]-0.083338[/C][C]-0.7592[/C][C]0.224928[/C][/ROW]
[ROW][C]26[/C][C]-0.136169[/C][C]-1.2406[/C][C]0.109131[/C][/ROW]
[ROW][C]27[/C][C]0.039427[/C][C]0.3592[/C][C]0.36018[/C][/ROW]
[ROW][C]28[/C][C]-0.038856[/C][C]-0.354[/C][C]0.362121[/C][/ROW]
[ROW][C]29[/C][C]-0.126526[/C][C]-1.1527[/C][C]0.126169[/C][/ROW]
[ROW][C]30[/C][C]-0.11104[/C][C]-1.0116[/C][C]0.157329[/C][/ROW]
[ROW][C]31[/C][C]0.200954[/C][C]1.8308[/C][C]0.035361[/C][/ROW]
[ROW][C]32[/C][C]0.028844[/C][C]0.2628[/C][C]0.396686[/C][/ROW]
[ROW][C]33[/C][C]-0.022227[/C][C]-0.2025[/C][C]0.420012[/C][/ROW]
[ROW][C]34[/C][C]-0.182117[/C][C]-1.6592[/C][C]0.050429[/C][/ROW]
[ROW][C]35[/C][C]0.100979[/C][C]0.92[/C][C]0.180129[/C][/ROW]
[ROW][C]36[/C][C]-0.053129[/C][C]-0.484[/C][C]0.314821[/C][/ROW]
[ROW][C]37[/C][C]0.042006[/C][C]0.3827[/C][C]0.351463[/C][/ROW]
[ROW][C]38[/C][C]-0.030261[/C][C]-0.2757[/C][C]0.391736[/C][/ROW]
[ROW][C]39[/C][C]-0.006894[/C][C]-0.0628[/C][C]0.475036[/C][/ROW]
[ROW][C]40[/C][C]0.036332[/C][C]0.331[/C][C]0.370739[/C][/ROW]
[ROW][C]41[/C][C]-0.001763[/C][C]-0.0161[/C][C]0.493612[/C][/ROW]
[ROW][C]42[/C][C]-0.132101[/C][C]-1.2035[/C][C]0.116103[/C][/ROW]
[ROW][C]43[/C][C]0.032932[/C][C]0.3[/C][C]0.382455[/C][/ROW]
[ROW][C]44[/C][C]-0.037636[/C][C]-0.3429[/C][C]0.366279[/C][/ROW]
[ROW][C]45[/C][C]-0.107578[/C][C]-0.9801[/C][C]0.164947[/C][/ROW]
[ROW][C]46[/C][C]-0.072469[/C][C]-0.6602[/C][C]0.255468[/C][/ROW]
[ROW][C]47[/C][C]-0.069844[/C][C]-0.6363[/C][C]0.263163[/C][/ROW]
[ROW][C]48[/C][C]0.02721[/C][C]0.2479[/C][C]0.402412[/C][/ROW]
[/TABLE]
Source: https://freestatistics.org/blog/index.php?pk=232314&T=2

Globally Unique Identifier (entire table): ba.freestatistics.org/blog/index.php?pk=232314&T=2

As an alternative you can also use a QR Code:  

The GUIDs for individual cells are displayed in the table below:

Partial Autocorrelation Function
Time lag kPACF(k)T-STATP-value
10.3145812.8660.002633
20.0323450.29470.384487
30.0285360.260.397764
40.0409250.37280.355109
5-0.09814-0.89410.186927
6-0.011436-0.10420.458636
7-0.086057-0.7840.217631
8-0.19994-1.82150.036064
90.1007350.91770.180707
10-0.16481-1.50150.068511
110.206951.88540.031437
12-0.231857-2.11230.018832
13-0.1511-1.37660.086171
140.0291670.26570.395556
150.0508320.46310.322253
160.0659280.60060.274862
17-0.038279-0.34870.364084
180.0011060.01010.495994
190.0380380.34650.364905
20-0.110193-1.00390.15917
21-0.088376-0.80510.211518
22-0.149228-1.35950.08883
230.0782610.7130.238926
24-0.153612-1.39950.0827
25-0.083338-0.75920.224928
26-0.136169-1.24060.109131
270.0394270.35920.36018
28-0.038856-0.3540.362121
29-0.126526-1.15270.126169
30-0.11104-1.01160.157329
310.2009541.83080.035361
320.0288440.26280.396686
33-0.022227-0.20250.420012
34-0.182117-1.65920.050429
350.1009790.920.180129
36-0.053129-0.4840.314821
370.0420060.38270.351463
38-0.030261-0.27570.391736
39-0.006894-0.06280.475036
400.0363320.3310.370739
41-0.001763-0.01610.493612
42-0.132101-1.20350.116103
430.0329320.30.382455
44-0.037636-0.34290.366279
45-0.107578-0.98010.164947
46-0.072469-0.66020.255468
47-0.069844-0.63630.263163
480.027210.24790.402412


Parameters (Session):
par1 = 48 ; par2 = 1 ; par3 = 1 ; par4 = 0 ; par5 = 12 ; par6 = White Noise ; par7 = 0.95 ;
Parameters (R input):
par1 = 48 ; par2 = 1 ; par3 = 1 ; par4 = 0 ; par5 = 12 ; par6 = White Noise ; par7 = 0.95 ; par8 = ;
R code (references can be found in the software module):
if (par1 == 'Default') {
par1 = 10*log10(length(x))
} else {
par1 <- as.numeric(par1)
}
par2 <- as.numeric(par2)
par3 <- as.numeric(par3)
par4 <- as.numeric(par4)
par5 <- as.numeric(par5)
if (par6 == 'White Noise') par6 <- 'white' else par6 <- 'ma'
par7 <- as.numeric(par7)
if (par8 != '') par8 <- as.numeric(par8)
ox <- x
if (par8 == '') {
if (par2 == 0) {
x <- log(x)
} else {
x <- (x ^ par2 - 1) / par2
}
} else {
x <- log(x,base=par8)
}
if (par3 > 0) x <- diff(x,lag=1,difference=par3)
if (par4 > 0) x <- diff(x,lag=par5,difference=par4)
bitmap(file='picts.png')
op <- par(mfrow=c(2,1))
plot(ox,type='l',main='Original Time Series',xlab='time',ylab='value')
if (par8=='') {
mytitle <- paste('Working Time Series (lambda=',par2,', d=',par3,', D=',par4,')',sep='')
mysub <- paste('(lambda=',par2,', d=',par3,', D=',par4,', CI=', par7, ', CI type=',par6,')',sep='')
} else {
mytitle <- paste('Working Time Series (base=',par8,', d=',par3,', D=',par4,')',sep='')
mysub <- paste('(base=',par8,', d=',par3,', D=',par4,', CI=', par7, ', CI type=',par6,')',sep='')
}
plot(x,type='l', main=mytitle,xlab='time',ylab='value')
par(op)
dev.off()
bitmap(file='pic1.png')
racf <- acf(x, par1, main='Autocorrelation', xlab='time lag', ylab='ACF', ci.type=par6, ci=par7, sub=mysub)
dev.off()
bitmap(file='pic2.png')
rpacf <- pacf(x,par1,main='Partial Autocorrelation',xlab='lags',ylab='PACF',sub=mysub)
dev.off()
(myacf <- c(racf$acf))
(mypacf <- c(rpacf$acf))
lengthx <- length(x)
sqrtn <- sqrt(lengthx)
load(file='createtable')
a<-table.start()
a<-table.row.start(a)
a<-table.element(a,'Autocorrelation Function',4,TRUE)
a<-table.row.end(a)
a<-table.row.start(a)
a<-table.element(a,'Time lag k',header=TRUE)
a<-table.element(a,hyperlink('basics.htm','ACF(k)','click here for more information about the Autocorrelation Function'),header=TRUE)
a<-table.element(a,'T-STAT',header=TRUE)
a<-table.element(a,'P-value',header=TRUE)
a<-table.row.end(a)
for (i in 2:(par1+1)) {
a<-table.row.start(a)
a<-table.element(a,i-1,header=TRUE)
a<-table.element(a,round(myacf[i],6))
mytstat <- myacf[i]*sqrtn
a<-table.element(a,round(mytstat,4))
a<-table.element(a,round(1-pt(abs(mytstat),lengthx),6))
a<-table.row.end(a)
}
a<-table.end(a)
table.save(a,file='mytable.tab')
a<-table.start()
a<-table.row.start(a)
a<-table.element(a,'Partial Autocorrelation Function',4,TRUE)
a<-table.row.end(a)
a<-table.row.start(a)
a<-table.element(a,'Time lag k',header=TRUE)
a<-table.element(a,hyperlink('basics.htm','PACF(k)','click here for more information about the Partial Autocorrelation Function'),header=TRUE)
a<-table.element(a,'T-STAT',header=TRUE)
a<-table.element(a,'P-value',header=TRUE)
a<-table.row.end(a)
for (i in 1:par1) {
a<-table.row.start(a)
a<-table.element(a,i,header=TRUE)
a<-table.element(a,round(mypacf[i],6))
mytstat <- mypacf[i]*sqrtn
a<-table.element(a,round(mytstat,4))
a<-table.element(a,round(1-pt(abs(mytstat),lengthx),6))
a<-table.row.end(a)
}
a<-table.end(a)
table.save(a,file='mytable1.tab')