| Tabulation of Results | ||||
| Learning4 x Separate4 | ||||
| A | B | C | D | A | 27 | 23 | 17 | 16 | C | 10 | 12 | 12 | 9 | D | 7 | 11 | 9 | 9 |
| Tabulation of Expected Results | ||||
| Learning4 x Separate4 | ||||
| A | B | C | D | A | 22.54 | 23.57 | 19.47 | 17.42 | C | 11.68 | 12.21 | 10.09 | 9.02 | D | 9.78 | 10.22 | 8.44 | 7.56 |
| Statistical Results | |
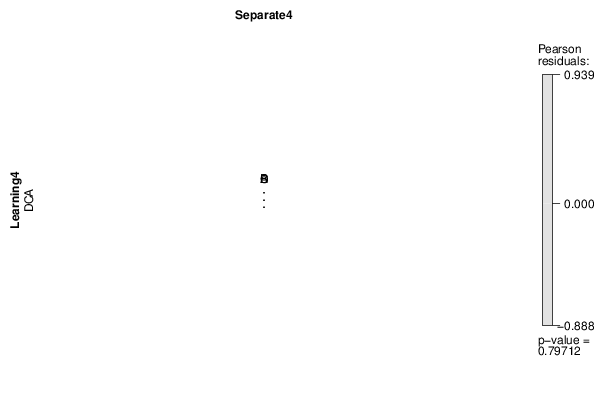
| Pearson's Chi-squared test | |
| Pearson Chi Square Statistic | 3.09 |
| Degrees of Freedom | 6 |
| P value | 0.8 |