| Tabulation of Results | ||
| Software2 x Separate2 | ||
| HI | LO | HI | 64 | 44 | LO | 26 | 28 |
| Tabulation of Expected Results | ||
| Software2 x Separate2 | ||
| HI | LO | HI | 60 | 48 | LO | 30 | 24 |
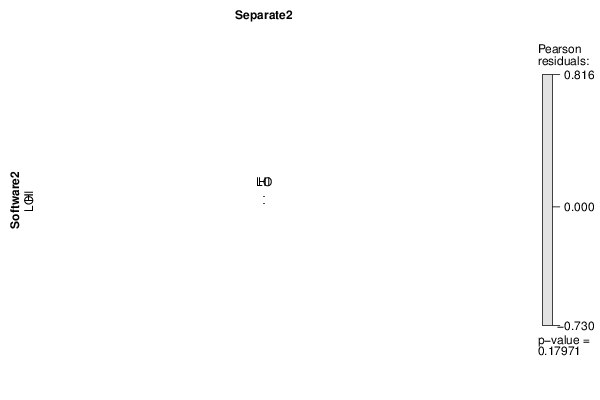
| Statistical Results | |
| Pearson's Chi-squared test with Yates' continuity correction | |
| Pearson Chi Square Statistic | 1.38 |
| Degrees of Freedom | 1 |
| P value | 0.24 |