Free Statistics

of Irreproducible Research!

Author's title

Author*The author of this computation has been verified*
R Software Modulerwasp_arimabackwardselection.wasp
Title produced by softwareARIMA Backward Selection
Date of computationSun, 15 Dec 2013 08:15:54 -0500
Cite this page as followsStatistical Computations at FreeStatistics.org, Office for Research Development and Education, URL https://freestatistics.org/blog/index.php?v=date/2013/Dec/15/t1387113396kb75424z8nt8p7t.htm/, Retrieved Thu, 25 Apr 2024 04:08:43 +0000
Statistical Computations at FreeStatistics.org, Office for Research Development and Education, URL https://freestatistics.org/blog/index.php?pk=232350, Retrieved Thu, 25 Apr 2024 04:08:43 +0000
QR Codes:

Original text written by user:
IsPrivate?No (this computation is public)
User-defined keywords
Estimated Impact192
Family? (F = Feedback message, R = changed R code, M = changed R Module, P = changed Parameters, D = changed Data)
-     [(Partial) Autocorrelation Function] [Wine sales - ACF] [2013-12-15 12:41:55] [e1b6e5c15a370139a1f66dc7648af660]
- RMP     [ARIMA Backward Selection] [Wine sales - ARIM...] [2013-12-15 13:15:54] [e87fe8ad852a0fa5d933f43041f410cc] [Current]
Feedback Forum

Post a new message
Dataseries X:
1954
2302
3054
2414
2226
2725
2589
3470
2400
3180
4009
3924
2072
2434
2956
2828
2687
2629
3150
4119
3030
3055
3821
4001
2529
2472
3134
2789
2758
2993
3282
3437
2804
3076
3782
3889
2271
2452
3084
2522
2769
3438
2839
3746
2632
2851
3871
3618
2389
2344
2678
2492
2858
2246
2800
3869
3007
3023
3907
4209


Summary of computational transaction
Raw Inputview raw input (R code)
Raw Outputview raw output of R engine
Computing time18 seconds
R Server'George Udny Yule' @ yule.wessa.net

\begin{tabular}{lllllllll}
\hline
Summary of computational transaction \tabularnewline
Raw Input & view raw input (R code)  \tabularnewline
Raw Output & view raw output of R engine  \tabularnewline
Computing time & 18 seconds \tabularnewline
R Server & 'George Udny Yule' @ yule.wessa.net \tabularnewline
\hline
\end{tabular}
%Source: https://freestatistics.org/blog/index.php?pk=232350&T=0

[TABLE]
[ROW][C]Summary of computational transaction[/C][/ROW]
[ROW][C]Raw Input[/C][C]view raw input (R code) [/C][/ROW]
[ROW][C]Raw Output[/C][C]view raw output of R engine [/C][/ROW]
[ROW][C]Computing time[/C][C]18 seconds[/C][/ROW]
[ROW][C]R Server[/C][C]'George Udny Yule' @ yule.wessa.net[/C][/ROW]
[/TABLE]
Source: https://freestatistics.org/blog/index.php?pk=232350&T=0

Globally Unique Identifier (entire table): ba.freestatistics.org/blog/index.php?pk=232350&T=0

As an alternative you can also use a QR Code:  

The GUIDs for individual cells are displayed in the table below:

Summary of computational transaction
Raw Inputview raw input (R code)
Raw Outputview raw output of R engine
Computing time18 seconds
R Server'George Udny Yule' @ yule.wessa.net


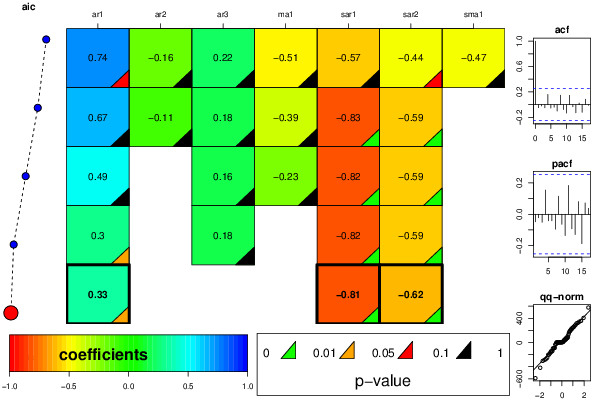
ARIMA Parameter Estimation and Backward Selection
Iterationar1ar2ar3ma1sar1sar2sma1
Estimates ( 1 )0.7351-0.16050.2248-0.506-0.5655-0.4404-0.475
(p-val)(0.0802 )(0.4307 )(0.1902 )(0.2068 )(0.1101 )(0.091 )(0.4427 )
Estimates ( 2 )0.6743-0.11190.1758-0.3897-0.829-0.58860
(p-val)(0.1677 )(0.609 )(0.2836 )(0.4084 )(0 )(0 )(NA )
Estimates ( 3 )0.489400.1605-0.2278-0.817-0.59310
(p-val)(0.2039 )(NA )(0.303 )(0.6072 )(0 )(0 )(NA )
Estimates ( 4 )0.299700.18090-0.8239-0.59370
(p-val)(0.043 )(NA )(0.2078 )(NA )(0 )(0 )(NA )
Estimates ( 5 )0.33000-0.8122-0.62180
(p-val)(0.0285 )(NA )(NA )(NA )(0 )(0 )(NA )
Estimates ( 6 )NANANANANANANA
(p-val)(NA )(NA )(NA )(NA )(NA )(NA )(NA )
Estimates ( 7 )NANANANANANANA
(p-val)(NA )(NA )(NA )(NA )(NA )(NA )(NA )
Estimates ( 8 )NANANANANANANA
(p-val)(NA )(NA )(NA )(NA )(NA )(NA )(NA )
Estimates ( 9 )NANANANANANANA
(p-val)(NA )(NA )(NA )(NA )(NA )(NA )(NA )
Estimates ( 10 )NANANANANANANA
(p-val)(NA )(NA )(NA )(NA )(NA )(NA )(NA )
Estimates ( 11 )NANANANANANANA
(p-val)(NA )(NA )(NA )(NA )(NA )(NA )(NA )
Estimates ( 12 )NANANANANANANA
(p-val)(NA )(NA )(NA )(NA )(NA )(NA )(NA )
Estimates ( 13 )NANANANANANANA
(p-val)(NA )(NA )(NA )(NA )(NA )(NA )(NA )

\begin{tabular}{lllllllll}
\hline
ARIMA Parameter Estimation and Backward Selection \tabularnewline
Iteration & ar1 & ar2 & ar3 & ma1 & sar1 & sar2 & sma1 \tabularnewline
Estimates ( 1 ) & 0.7351 & -0.1605 & 0.2248 & -0.506 & -0.5655 & -0.4404 & -0.475 \tabularnewline
(p-val) & (0.0802 ) & (0.4307 ) & (0.1902 ) & (0.2068 ) & (0.1101 ) & (0.091 ) & (0.4427 ) \tabularnewline
Estimates ( 2 ) & 0.6743 & -0.1119 & 0.1758 & -0.3897 & -0.829 & -0.5886 & 0 \tabularnewline
(p-val) & (0.1677 ) & (0.609 ) & (0.2836 ) & (0.4084 ) & (0 ) & (0 ) & (NA ) \tabularnewline
Estimates ( 3 ) & 0.4894 & 0 & 0.1605 & -0.2278 & -0.817 & -0.5931 & 0 \tabularnewline
(p-val) & (0.2039 ) & (NA ) & (0.303 ) & (0.6072 ) & (0 ) & (0 ) & (NA ) \tabularnewline
Estimates ( 4 ) & 0.2997 & 0 & 0.1809 & 0 & -0.8239 & -0.5937 & 0 \tabularnewline
(p-val) & (0.043 ) & (NA ) & (0.2078 ) & (NA ) & (0 ) & (0 ) & (NA ) \tabularnewline
Estimates ( 5 ) & 0.33 & 0 & 0 & 0 & -0.8122 & -0.6218 & 0 \tabularnewline
(p-val) & (0.0285 ) & (NA ) & (NA ) & (NA ) & (0 ) & (0 ) & (NA ) \tabularnewline
Estimates ( 6 ) & NA & NA & NA & NA & NA & NA & NA \tabularnewline
(p-val) & (NA ) & (NA ) & (NA ) & (NA ) & (NA ) & (NA ) & (NA ) \tabularnewline
Estimates ( 7 ) & NA & NA & NA & NA & NA & NA & NA \tabularnewline
(p-val) & (NA ) & (NA ) & (NA ) & (NA ) & (NA ) & (NA ) & (NA ) \tabularnewline
Estimates ( 8 ) & NA & NA & NA & NA & NA & NA & NA \tabularnewline
(p-val) & (NA ) & (NA ) & (NA ) & (NA ) & (NA ) & (NA ) & (NA ) \tabularnewline
Estimates ( 9 ) & NA & NA & NA & NA & NA & NA & NA \tabularnewline
(p-val) & (NA ) & (NA ) & (NA ) & (NA ) & (NA ) & (NA ) & (NA ) \tabularnewline
Estimates ( 10 ) & NA & NA & NA & NA & NA & NA & NA \tabularnewline
(p-val) & (NA ) & (NA ) & (NA ) & (NA ) & (NA ) & (NA ) & (NA ) \tabularnewline
Estimates ( 11 ) & NA & NA & NA & NA & NA & NA & NA \tabularnewline
(p-val) & (NA ) & (NA ) & (NA ) & (NA ) & (NA ) & (NA ) & (NA ) \tabularnewline
Estimates ( 12 ) & NA & NA & NA & NA & NA & NA & NA \tabularnewline
(p-val) & (NA ) & (NA ) & (NA ) & (NA ) & (NA ) & (NA ) & (NA ) \tabularnewline
Estimates ( 13 ) & NA & NA & NA & NA & NA & NA & NA \tabularnewline
(p-val) & (NA ) & (NA ) & (NA ) & (NA ) & (NA ) & (NA ) & (NA ) \tabularnewline
\hline
\end{tabular}
%Source: https://freestatistics.org/blog/index.php?pk=232350&T=1

[TABLE]
[ROW][C]ARIMA Parameter Estimation and Backward Selection[/C][/ROW]
[ROW][C]Iteration[/C][C]ar1[/C][C]ar2[/C][C]ar3[/C][C]ma1[/C][C]sar1[/C][C]sar2[/C][C]sma1[/C][/ROW]
[ROW][C]Estimates ( 1 )[/C][C]0.7351[/C][C]-0.1605[/C][C]0.2248[/C][C]-0.506[/C][C]-0.5655[/C][C]-0.4404[/C][C]-0.475[/C][/ROW]
[ROW][C](p-val)[/C][C](0.0802 )[/C][C](0.4307 )[/C][C](0.1902 )[/C][C](0.2068 )[/C][C](0.1101 )[/C][C](0.091 )[/C][C](0.4427 )[/C][/ROW]
[ROW][C]Estimates ( 2 )[/C][C]0.6743[/C][C]-0.1119[/C][C]0.1758[/C][C]-0.3897[/C][C]-0.829[/C][C]-0.5886[/C][C]0[/C][/ROW]
[ROW][C](p-val)[/C][C](0.1677 )[/C][C](0.609 )[/C][C](0.2836 )[/C][C](0.4084 )[/C][C](0 )[/C][C](0 )[/C][C](NA )[/C][/ROW]
[ROW][C]Estimates ( 3 )[/C][C]0.4894[/C][C]0[/C][C]0.1605[/C][C]-0.2278[/C][C]-0.817[/C][C]-0.5931[/C][C]0[/C][/ROW]
[ROW][C](p-val)[/C][C](0.2039 )[/C][C](NA )[/C][C](0.303 )[/C][C](0.6072 )[/C][C](0 )[/C][C](0 )[/C][C](NA )[/C][/ROW]
[ROW][C]Estimates ( 4 )[/C][C]0.2997[/C][C]0[/C][C]0.1809[/C][C]0[/C][C]-0.8239[/C][C]-0.5937[/C][C]0[/C][/ROW]
[ROW][C](p-val)[/C][C](0.043 )[/C][C](NA )[/C][C](0.2078 )[/C][C](NA )[/C][C](0 )[/C][C](0 )[/C][C](NA )[/C][/ROW]
[ROW][C]Estimates ( 5 )[/C][C]0.33[/C][C]0[/C][C]0[/C][C]0[/C][C]-0.8122[/C][C]-0.6218[/C][C]0[/C][/ROW]
[ROW][C](p-val)[/C][C](0.0285 )[/C][C](NA )[/C][C](NA )[/C][C](NA )[/C][C](0 )[/C][C](0 )[/C][C](NA )[/C][/ROW]
[ROW][C]Estimates ( 6 )[/C][C]NA[/C][C]NA[/C][C]NA[/C][C]NA[/C][C]NA[/C][C]NA[/C][C]NA[/C][/ROW]
[ROW][C](p-val)[/C][C](NA )[/C][C](NA )[/C][C](NA )[/C][C](NA )[/C][C](NA )[/C][C](NA )[/C][C](NA )[/C][/ROW]
[ROW][C]Estimates ( 7 )[/C][C]NA[/C][C]NA[/C][C]NA[/C][C]NA[/C][C]NA[/C][C]NA[/C][C]NA[/C][/ROW]
[ROW][C](p-val)[/C][C](NA )[/C][C](NA )[/C][C](NA )[/C][C](NA )[/C][C](NA )[/C][C](NA )[/C][C](NA )[/C][/ROW]
[ROW][C]Estimates ( 8 )[/C][C]NA[/C][C]NA[/C][C]NA[/C][C]NA[/C][C]NA[/C][C]NA[/C][C]NA[/C][/ROW]
[ROW][C](p-val)[/C][C](NA )[/C][C](NA )[/C][C](NA )[/C][C](NA )[/C][C](NA )[/C][C](NA )[/C][C](NA )[/C][/ROW]
[ROW][C]Estimates ( 9 )[/C][C]NA[/C][C]NA[/C][C]NA[/C][C]NA[/C][C]NA[/C][C]NA[/C][C]NA[/C][/ROW]
[ROW][C](p-val)[/C][C](NA )[/C][C](NA )[/C][C](NA )[/C][C](NA )[/C][C](NA )[/C][C](NA )[/C][C](NA )[/C][/ROW]
[ROW][C]Estimates ( 10 )[/C][C]NA[/C][C]NA[/C][C]NA[/C][C]NA[/C][C]NA[/C][C]NA[/C][C]NA[/C][/ROW]
[ROW][C](p-val)[/C][C](NA )[/C][C](NA )[/C][C](NA )[/C][C](NA )[/C][C](NA )[/C][C](NA )[/C][C](NA )[/C][/ROW]
[ROW][C]Estimates ( 11 )[/C][C]NA[/C][C]NA[/C][C]NA[/C][C]NA[/C][C]NA[/C][C]NA[/C][C]NA[/C][/ROW]
[ROW][C](p-val)[/C][C](NA )[/C][C](NA )[/C][C](NA )[/C][C](NA )[/C][C](NA )[/C][C](NA )[/C][C](NA )[/C][/ROW]
[ROW][C]Estimates ( 12 )[/C][C]NA[/C][C]NA[/C][C]NA[/C][C]NA[/C][C]NA[/C][C]NA[/C][C]NA[/C][/ROW]
[ROW][C](p-val)[/C][C](NA )[/C][C](NA )[/C][C](NA )[/C][C](NA )[/C][C](NA )[/C][C](NA )[/C][C](NA )[/C][/ROW]
[ROW][C]Estimates ( 13 )[/C][C]NA[/C][C]NA[/C][C]NA[/C][C]NA[/C][C]NA[/C][C]NA[/C][C]NA[/C][/ROW]
[ROW][C](p-val)[/C][C](NA )[/C][C](NA )[/C][C](NA )[/C][C](NA )[/C][C](NA )[/C][C](NA )[/C][C](NA )[/C][/ROW]
[/TABLE]
Source: https://freestatistics.org/blog/index.php?pk=232350&T=1

Globally Unique Identifier (entire table): ba.freestatistics.org/blog/index.php?pk=232350&T=1

As an alternative you can also use a QR Code:  

The GUIDs for individual cells are displayed in the table below:

ARIMA Parameter Estimation and Backward Selection
Iterationar1ar2ar3ma1sar1sar2sma1
Estimates ( 1 )0.7351-0.16050.2248-0.506-0.5655-0.4404-0.475
(p-val)(0.0802 )(0.4307 )(0.1902 )(0.2068 )(0.1101 )(0.091 )(0.4427 )
Estimates ( 2 )0.6743-0.11190.1758-0.3897-0.829-0.58860
(p-val)(0.1677 )(0.609 )(0.2836 )(0.4084 )(0 )(0 )(NA )
Estimates ( 3 )0.489400.1605-0.2278-0.817-0.59310
(p-val)(0.2039 )(NA )(0.303 )(0.6072 )(0 )(0 )(NA )
Estimates ( 4 )0.299700.18090-0.8239-0.59370
(p-val)(0.043 )(NA )(0.2078 )(NA )(0 )(0 )(NA )
Estimates ( 5 )0.33000-0.8122-0.62180
(p-val)(0.0285 )(NA )(NA )(NA )(0 )(0 )(NA )
Estimates ( 6 )NANANANANANANA
(p-val)(NA )(NA )(NA )(NA )(NA )(NA )(NA )
Estimates ( 7 )NANANANANANANA
(p-val)(NA )(NA )(NA )(NA )(NA )(NA )(NA )
Estimates ( 8 )NANANANANANANA
(p-val)(NA )(NA )(NA )(NA )(NA )(NA )(NA )
Estimates ( 9 )NANANANANANANA
(p-val)(NA )(NA )(NA )(NA )(NA )(NA )(NA )
Estimates ( 10 )NANANANANANANA
(p-val)(NA )(NA )(NA )(NA )(NA )(NA )(NA )
Estimates ( 11 )NANANANANANANA
(p-val)(NA )(NA )(NA )(NA )(NA )(NA )(NA )
Estimates ( 12 )NANANANANANANA
(p-val)(NA )(NA )(NA )(NA )(NA )(NA )(NA )
Estimates ( 13 )NANANANANANANA
(p-val)(NA )(NA )(NA )(NA )(NA )(NA )(NA )


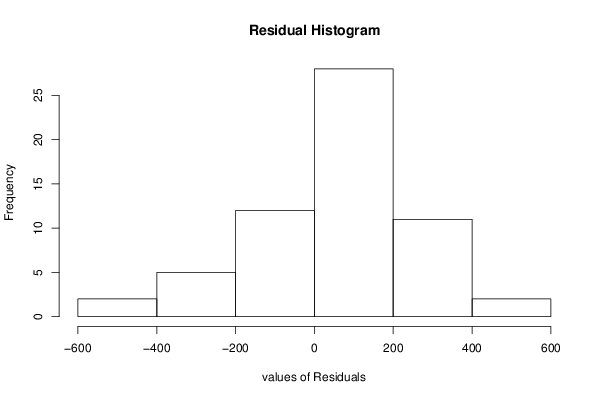
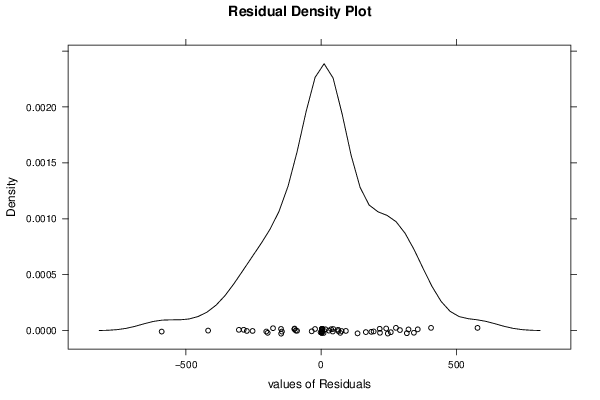
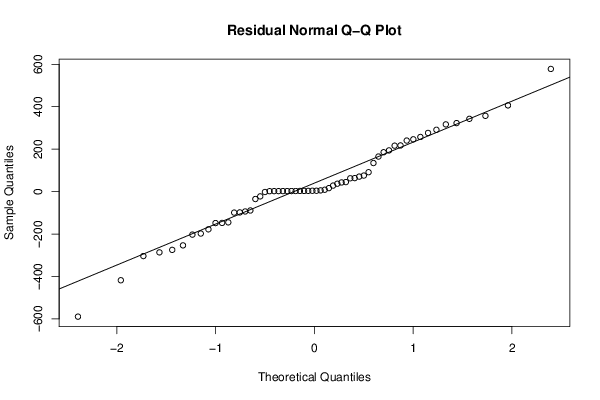
Estimated ARIMA Residuals
Value
3.92399029242162
75.6211589914564
63.5386867268408
-98.0465067604086
291.347148733612
216.449004934625
-147.761991357888
357.113120022239
276.469024273474
316.766358114744
-274.701130312602
-177.839211856224
16.4010481040969
406.320066352934
-22.5021920554171
62.7645273701096
37.0567934060334
194.223949586791
165.246422077262
246.535472247193
-417.894982542661
134.590713258734
-89.0430701174169
-34.9467651968433
-1.9241028843045
185.484643726903
43.0722546999734
8.76244213257575
-99.0059227711038
342.942963351255
578.122978042988
-197.686670114592
70.6416784123854
-148.313514285781
-286.421342740116
5.78907583254938
-304.022553332911
322.886776456884
-144.974672508071
-253.535544615309
-202.77178139155
240.499598153182
-589.492615779753
-93.657007138317
44.9348795541004
217.508300129296
28.289883849959
91.3871629486912
257.470962690904

\begin{tabular}{lllllllll}
\hline
Estimated ARIMA Residuals \tabularnewline
Value \tabularnewline
3.92399029242162 \tabularnewline
75.6211589914564 \tabularnewline
63.5386867268408 \tabularnewline
-98.0465067604086 \tabularnewline
291.347148733612 \tabularnewline
216.449004934625 \tabularnewline
-147.761991357888 \tabularnewline
357.113120022239 \tabularnewline
276.469024273474 \tabularnewline
316.766358114744 \tabularnewline
-274.701130312602 \tabularnewline
-177.839211856224 \tabularnewline
16.4010481040969 \tabularnewline
406.320066352934 \tabularnewline
-22.5021920554171 \tabularnewline
62.7645273701096 \tabularnewline
37.0567934060334 \tabularnewline
194.223949586791 \tabularnewline
165.246422077262 \tabularnewline
246.535472247193 \tabularnewline
-417.894982542661 \tabularnewline
134.590713258734 \tabularnewline
-89.0430701174169 \tabularnewline
-34.9467651968433 \tabularnewline
-1.9241028843045 \tabularnewline
185.484643726903 \tabularnewline
43.0722546999734 \tabularnewline
8.76244213257575 \tabularnewline
-99.0059227711038 \tabularnewline
342.942963351255 \tabularnewline
578.122978042988 \tabularnewline
-197.686670114592 \tabularnewline
70.6416784123854 \tabularnewline
-148.313514285781 \tabularnewline
-286.421342740116 \tabularnewline
5.78907583254938 \tabularnewline
-304.022553332911 \tabularnewline
322.886776456884 \tabularnewline
-144.974672508071 \tabularnewline
-253.535544615309 \tabularnewline
-202.77178139155 \tabularnewline
240.499598153182 \tabularnewline
-589.492615779753 \tabularnewline
-93.657007138317 \tabularnewline
44.9348795541004 \tabularnewline
217.508300129296 \tabularnewline
28.289883849959 \tabularnewline
91.3871629486912 \tabularnewline
257.470962690904 \tabularnewline
\hline
\end{tabular}
%Source: https://freestatistics.org/blog/index.php?pk=232350&T=2

[TABLE]
[ROW][C]Estimated ARIMA Residuals[/C][/ROW]
[ROW][C]Value[/C][/ROW]
[ROW][C]3.92399029242162[/C][/ROW]
[ROW][C]75.6211589914564[/C][/ROW]
[ROW][C]63.5386867268408[/C][/ROW]
[ROW][C]-98.0465067604086[/C][/ROW]
[ROW][C]291.347148733612[/C][/ROW]
[ROW][C]216.449004934625[/C][/ROW]
[ROW][C]-147.761991357888[/C][/ROW]
[ROW][C]357.113120022239[/C][/ROW]
[ROW][C]276.469024273474[/C][/ROW]
[ROW][C]316.766358114744[/C][/ROW]
[ROW][C]-274.701130312602[/C][/ROW]
[ROW][C]-177.839211856224[/C][/ROW]
[ROW][C]16.4010481040969[/C][/ROW]
[ROW][C]406.320066352934[/C][/ROW]
[ROW][C]-22.5021920554171[/C][/ROW]
[ROW][C]62.7645273701096[/C][/ROW]
[ROW][C]37.0567934060334[/C][/ROW]
[ROW][C]194.223949586791[/C][/ROW]
[ROW][C]165.246422077262[/C][/ROW]
[ROW][C]246.535472247193[/C][/ROW]
[ROW][C]-417.894982542661[/C][/ROW]
[ROW][C]134.590713258734[/C][/ROW]
[ROW][C]-89.0430701174169[/C][/ROW]
[ROW][C]-34.9467651968433[/C][/ROW]
[ROW][C]-1.9241028843045[/C][/ROW]
[ROW][C]185.484643726903[/C][/ROW]
[ROW][C]43.0722546999734[/C][/ROW]
[ROW][C]8.76244213257575[/C][/ROW]
[ROW][C]-99.0059227711038[/C][/ROW]
[ROW][C]342.942963351255[/C][/ROW]
[ROW][C]578.122978042988[/C][/ROW]
[ROW][C]-197.686670114592[/C][/ROW]
[ROW][C]70.6416784123854[/C][/ROW]
[ROW][C]-148.313514285781[/C][/ROW]
[ROW][C]-286.421342740116[/C][/ROW]
[ROW][C]5.78907583254938[/C][/ROW]
[ROW][C]-304.022553332911[/C][/ROW]
[ROW][C]322.886776456884[/C][/ROW]
[ROW][C]-144.974672508071[/C][/ROW]
[ROW][C]-253.535544615309[/C][/ROW]
[ROW][C]-202.77178139155[/C][/ROW]
[ROW][C]240.499598153182[/C][/ROW]
[ROW][C]-589.492615779753[/C][/ROW]
[ROW][C]-93.657007138317[/C][/ROW]
[ROW][C]44.9348795541004[/C][/ROW]
[ROW][C]217.508300129296[/C][/ROW]
[ROW][C]28.289883849959[/C][/ROW]
[ROW][C]91.3871629486912[/C][/ROW]
[ROW][C]257.470962690904[/C][/ROW]
[/TABLE]
Source: https://freestatistics.org/blog/index.php?pk=232350&T=2

Globally Unique Identifier (entire table): ba.freestatistics.org/blog/index.php?pk=232350&T=2

As an alternative you can also use a QR Code:  

The GUIDs for individual cells are displayed in the table below:

Estimated ARIMA Residuals
Value
3.92399029242162
75.6211589914564
63.5386867268408
-98.0465067604086
291.347148733612
216.449004934625
-147.761991357888
357.113120022239
276.469024273474
316.766358114744
-274.701130312602
-177.839211856224
16.4010481040969
406.320066352934
-22.5021920554171
62.7645273701096
37.0567934060334
194.223949586791
165.246422077262
246.535472247193
-417.894982542661
134.590713258734
-89.0430701174169
-34.9467651968433
-1.9241028843045
185.484643726903
43.0722546999734
8.76244213257575
-99.0059227711038
342.942963351255
578.122978042988
-197.686670114592
70.6416784123854
-148.313514285781
-286.421342740116
5.78907583254938
-304.022553332911
322.886776456884
-144.974672508071
-253.535544615309
-202.77178139155
240.499598153182
-589.492615779753
-93.657007138317
44.9348795541004
217.508300129296
28.289883849959
91.3871629486912
257.470962690904


Parameters (Session):
par1 = 12 ;
Parameters (R input):
par1 = FALSE ; par2 = 1 ; par3 = 0 ; par4 = 1 ; par5 = 12 ; par6 = 3 ; par7 = 1 ; par8 = 2 ; par9 = 1 ;
R code (references can be found in the software module):
library(lattice)
if (par1 == 'TRUE') par1 <- TRUE
if (par1 == 'FALSE') par1 <- FALSE
par2 <- as.numeric(par2) #Box-Cox lambda transformation parameter
par3 <- as.numeric(par3) #degree of non-seasonal differencing
par4 <- as.numeric(par4) #degree of seasonal differencing
par5 <- as.numeric(par5) #seasonal period
par6 <- as.numeric(par6) #degree (p) of the non-seasonal AR(p) polynomial
par7 <- as.numeric(par7) #degree (q) of the non-seasonal MA(q) polynomial
par8 <- as.numeric(par8) #degree (P) of the seasonal AR(P) polynomial
par9 <- as.numeric(par9) #degree (Q) of the seasonal MA(Q) polynomial
armaGR <- function(arima.out, names, n){
try1 <- arima.out$coef
try2 <- sqrt(diag(arima.out$var.coef))
try.data.frame <- data.frame(matrix(NA,ncol=4,nrow=length(names)))
dimnames(try.data.frame) <- list(names,c('coef','std','tstat','pv'))
try.data.frame[,1] <- try1
for(i in 1:length(try2)) try.data.frame[which(rownames(try.data.frame)==names(try2)[i]),2] <- try2[i]
try.data.frame[,3] <- try.data.frame[,1] / try.data.frame[,2]
try.data.frame[,4] <- round((1-pt(abs(try.data.frame[,3]),df=n-(length(try2)+1)))*2,5)
vector <- rep(NA,length(names))
vector[is.na(try.data.frame[,4])] <- 0
maxi <- which.max(try.data.frame[,4])
continue <- max(try.data.frame[,4],na.rm=TRUE) > .05
vector[maxi] <- 0
list(summary=try.data.frame,next.vector=vector,continue=continue)
}
arimaSelect <- function(series, order=c(13,0,0), seasonal=list(order=c(2,0,0),period=12), include.mean=F){
nrc <- order[1]+order[3]+seasonal$order[1]+seasonal$order[3]
coeff <- matrix(NA, nrow=nrc*2, ncol=nrc)
pval <- matrix(NA, nrow=nrc*2, ncol=nrc)
mylist <- rep(list(NULL), nrc)
names <- NULL
if(order[1] > 0) names <- paste('ar',1:order[1],sep='')
if(order[3] > 0) names <- c( names , paste('ma',1:order[3],sep='') )
if(seasonal$order[1] > 0) names <- c(names, paste('sar',1:seasonal$order[1],sep=''))
if(seasonal$order[3] > 0) names <- c(names, paste('sma',1:seasonal$order[3],sep=''))
arima.out <- arima(series, order=order, seasonal=seasonal, include.mean=include.mean, method='ML')
mylist[[1]] <- arima.out
last.arma <- armaGR(arima.out, names, length(series))
mystop <- FALSE
i <- 1
coeff[i,] <- last.arma[[1]][,1]
pval [i,] <- last.arma[[1]][,4]
i <- 2
aic <- arima.out$aic
while(!mystop){
mylist[[i]] <- arima.out
arima.out <- arima(series, order=order, seasonal=seasonal, include.mean=include.mean, method='ML', fixed=last.arma$next.vector)
aic <- c(aic, arima.out$aic)
last.arma <- armaGR(arima.out, names, length(series))
mystop <- !last.arma$continue
coeff[i,] <- last.arma[[1]][,1]
pval [i,] <- last.arma[[1]][,4]
i <- i+1
}
list(coeff, pval, mylist, aic=aic)
}
arimaSelectplot <- function(arimaSelect.out,noms,choix){
noms <- names(arimaSelect.out[[3]][[1]]$coef)
coeff <- arimaSelect.out[[1]]
k <- min(which(is.na(coeff[,1])))-1
coeff <- coeff[1:k,]
pval <- arimaSelect.out[[2]][1:k,]
aic <- arimaSelect.out$aic[1:k]
coeff[coeff==0] <- NA
n <- ncol(coeff)
if(missing(choix)) choix <- k
layout(matrix(c(1,1,1,2,
3,3,3,2,
3,3,3,4,
5,6,7,7),nr=4),
widths=c(10,35,45,15),
heights=c(30,30,15,15))
couleurs <- rainbow(75)[1:50]#(50)
ticks <- pretty(coeff)
par(mar=c(1,1,3,1))
plot(aic,k:1-.5,type='o',pch=21,bg='blue',cex=2,axes=F,lty=2,xpd=NA)
points(aic[choix],k-choix+.5,pch=21,cex=4,bg=2,xpd=NA)
title('aic',line=2)
par(mar=c(3,0,0,0))
plot(0,axes=F,xlab='',ylab='',xlim=range(ticks),ylim=c(.1,1))
rect(xleft = min(ticks) + (0:49)/50*(max(ticks)-min(ticks)),
xright = min(ticks) + (1:50)/50*(max(ticks)-min(ticks)),
ytop = rep(1,50),
ybottom= rep(0,50),col=couleurs,border=NA)
axis(1,ticks)
rect(xleft=min(ticks),xright=max(ticks),ytop=1,ybottom=0)
text(mean(coeff,na.rm=T),.5,'coefficients',cex=2,font=2)
par(mar=c(1,1,3,1))
image(1:n,1:k,t(coeff[k:1,]),axes=F,col=couleurs,zlim=range(ticks))
for(i in 1:n) for(j in 1:k) if(!is.na(coeff[j,i])) {
if(pval[j,i]<.01) symb = 'green'
else if( (pval[j,i]<.05) & (pval[j,i]>=.01)) symb = 'orange'
else if( (pval[j,i]<.1) & (pval[j,i]>=.05)) symb = 'red'
else symb = 'black'
polygon(c(i+.5 ,i+.2 ,i+.5 ,i+.5),
c(k-j+0.5,k-j+0.5,k-j+0.8,k-j+0.5),
col=symb)
if(j==choix) {
rect(xleft=i-.5,
xright=i+.5,
ybottom=k-j+1.5,
ytop=k-j+.5,
lwd=4)
text(i,
k-j+1,
round(coeff[j,i],2),
cex=1.2,
font=2)
}
else{
rect(xleft=i-.5,xright=i+.5,ybottom=k-j+1.5,ytop=k-j+.5)
text(i,k-j+1,round(coeff[j,i],2),cex=1.2,font=1)
}
}
axis(3,1:n,noms)
par(mar=c(0.5,0,0,0.5))
plot(0,axes=F,xlab='',ylab='',type='n',xlim=c(0,8),ylim=c(-.2,.8))
cols <- c('green','orange','red','black')
niv <- c('0','0.01','0.05','0.1')
for(i in 0:3){
polygon(c(1+2*i ,1+2*i ,1+2*i-.5 ,1+2*i),
c(.4 ,.7 , .4 , .4),
col=cols[i+1])
text(2*i,0.5,niv[i+1],cex=1.5)
}
text(8,.5,1,cex=1.5)
text(4,0,'p-value',cex=2)
box()
residus <- arimaSelect.out[[3]][[choix]]$res
par(mar=c(1,2,4,1))
acf(residus,main='')
title('acf',line=.5)
par(mar=c(1,2,4,1))
pacf(residus,main='')
title('pacf',line=.5)
par(mar=c(2,2,4,1))
qqnorm(residus,main='')
title('qq-norm',line=.5)
qqline(residus)
residus
}
if (par2 == 0) x <- log(x)
if (par2 != 0) x <- x^par2
(selection <- arimaSelect(x, order=c(par6,par3,par7), seasonal=list(order=c(par8,par4,par9), period=par5)))
bitmap(file='test1.png')
resid <- arimaSelectplot(selection)
dev.off()
resid
bitmap(file='test2.png')
acf(resid,length(resid)/2, main='Residual Autocorrelation Function')
dev.off()
bitmap(file='test3.png')
pacf(resid,length(resid)/2, main='Residual Partial Autocorrelation Function')
dev.off()
bitmap(file='test4.png')
cpgram(resid, main='Residual Cumulative Periodogram')
dev.off()
bitmap(file='test5.png')
hist(resid, main='Residual Histogram', xlab='values of Residuals')
dev.off()
bitmap(file='test6.png')
densityplot(~resid,col='black',main='Residual Density Plot', xlab='values of Residuals')
dev.off()
bitmap(file='test7.png')
qqnorm(resid, main='Residual Normal Q-Q Plot')
qqline(resid)
dev.off()
ncols <- length(selection[[1]][1,])
nrows <- length(selection[[2]][,1])-1
load(file='createtable')
a<-table.start()
a<-table.row.start(a)
a<-table.element(a,'ARIMA Parameter Estimation and Backward Selection', ncols+1,TRUE)
a<-table.row.end(a)
a<-table.row.start(a)
a<-table.element(a,'Iteration', header=TRUE)
for (i in 1:ncols) {
a<-table.element(a,names(selection[[3]][[1]]$coef)[i],header=TRUE)
}
a<-table.row.end(a)
for (j in 1:nrows) {
a<-table.row.start(a)
mydum <- 'Estimates ('
mydum <- paste(mydum,j)
mydum <- paste(mydum,')')
a<-table.element(a,mydum, header=TRUE)
for (i in 1:ncols) {
a<-table.element(a,round(selection[[1]][j,i],4))
}
a<-table.row.end(a)
a<-table.row.start(a)
a<-table.element(a,'(p-val)', header=TRUE)
for (i in 1:ncols) {
mydum <- '('
mydum <- paste(mydum,round(selection[[2]][j,i],4),sep='')
mydum <- paste(mydum,')')
a<-table.element(a,mydum)
}
a<-table.row.end(a)
}
a<-table.end(a)
table.save(a,file='mytable.tab')
a<-table.start()
a<-table.row.start(a)
a<-table.element(a,'Estimated ARIMA Residuals', 1,TRUE)
a<-table.row.end(a)
a<-table.row.start(a)
a<-table.element(a,'Value', 1,TRUE)
a<-table.row.end(a)
for (i in (par4*par5+par3):length(resid)) {
a<-table.row.start(a)
a<-table.element(a,resid[i])
a<-table.row.end(a)
}
a<-table.end(a)
table.save(a,file='mytable1.tab')