Free Statistics

of Irreproducible Research!

Author's title

Author*Unverified author*
R Software Modulerwasp_exponentialsmoothing.wasp
Title produced by softwareExponential Smoothing
Date of computationMon, 16 Dec 2013 05:19:46 -0500
Cite this page as followsStatistical Computations at FreeStatistics.org, Office for Research Development and Education, URL https://freestatistics.org/blog/index.php?v=date/2013/Dec/16/t13871894414ivs4rtdljawiae.htm/, Retrieved Sat, 20 Apr 2024 00:25:57 +0000
Statistical Computations at FreeStatistics.org, Office for Research Development and Education, URL https://freestatistics.org/blog/index.php?pk=232382, Retrieved Sat, 20 Apr 2024 00:25:57 +0000
QR Codes:

Original text written by user:
IsPrivate?No (this computation is public)
User-defined keywords
Estimated Impact84
Family? (F = Feedback message, R = changed R code, M = changed R Module, P = changed Parameters, D = changed Data)
-     [Exponential Smoothing] [] [2013-12-16 10:06:39] [4137616dc99e71bd0abe7ac75f4ed0c6]
- R PD    [Exponential Smoothing] [] [2013-12-16 10:19:46] [548ba37af61861f215c3470847960b18] [Current]
Feedback Forum

Post a new message
Dataseries X:
462.23
464.79
465.22
468.52
469.02
469.15
469.15
469.15
469.15
469.41
469.45
469.45
469.93
477.19
478.97
480.44
480.56
481.8
483.24
483.45
483.53
483.59
483.59
483.59
492.36
495.71
499.29
499.78
500
500
500.29
500.42
500.61
498.9
499.06
496.61
498.41
501.26
505.4
506.07
506.2
507.14
507.14
507.28
507.34
507.48
506.97
506.97
510.1
515.84
519
520.1
521.26
521.04
521.12
521.12
521.1
521.16
521.14
521.13
522.17
531.39
532.12
533.34
535.72
536.25
536.25
536.68
536.76
536.79
536.99
536.99
542.38
544.1
546.96
547.04
550.27
550.32
551.17
552.83
552.35
552.44
552.47
548.78


Summary of computational transaction
Raw Inputview raw input (R code)
Raw Outputview raw output of R engine
Computing time3 seconds
R Server'Gwilym Jenkins' @ jenkins.wessa.net

\begin{tabular}{lllllllll}
\hline
Summary of computational transaction \tabularnewline
Raw Input & view raw input (R code)  \tabularnewline
Raw Output & view raw output of R engine  \tabularnewline
Computing time & 3 seconds \tabularnewline
R Server & 'Gwilym Jenkins' @ jenkins.wessa.net \tabularnewline
\hline
\end{tabular}
%Source: https://freestatistics.org/blog/index.php?pk=232382&T=0

[TABLE]
[ROW][C]Summary of computational transaction[/C][/ROW]
[ROW][C]Raw Input[/C][C]view raw input (R code) [/C][/ROW]
[ROW][C]Raw Output[/C][C]view raw output of R engine [/C][/ROW]
[ROW][C]Computing time[/C][C]3 seconds[/C][/ROW]
[ROW][C]R Server[/C][C]'Gwilym Jenkins' @ jenkins.wessa.net[/C][/ROW]
[/TABLE]
Source: https://freestatistics.org/blog/index.php?pk=232382&T=0

Globally Unique Identifier (entire table): ba.freestatistics.org/blog/index.php?pk=232382&T=0

As an alternative you can also use a QR Code:  

The GUIDs for individual cells are displayed in the table below:

Summary of computational transaction
Raw Inputview raw input (R code)
Raw Outputview raw output of R engine
Computing time3 seconds
R Server'Gwilym Jenkins' @ jenkins.wessa.net


Estimated Parameters of Exponential Smoothing
ParameterValue
alpha0.752013114227701
beta0
gamma0.75899014078033

\begin{tabular}{lllllllll}
\hline
Estimated Parameters of Exponential Smoothing \tabularnewline
Parameter & Value \tabularnewline
alpha & 0.752013114227701 \tabularnewline
beta & 0 \tabularnewline
gamma & 0.75899014078033 \tabularnewline
\hline
\end{tabular}
%Source: https://freestatistics.org/blog/index.php?pk=232382&T=1

[TABLE]
[ROW][C]Estimated Parameters of Exponential Smoothing[/C][/ROW]
[ROW][C]Parameter[/C][C]Value[/C][/ROW]
[ROW][C]alpha[/C][C]0.752013114227701[/C][/ROW]
[ROW][C]beta[/C][C]0[/C][/ROW]
[ROW][C]gamma[/C][C]0.75899014078033[/C][/ROW]
[/TABLE]
Source: https://freestatistics.org/blog/index.php?pk=232382&T=1

Globally Unique Identifier (entire table): ba.freestatistics.org/blog/index.php?pk=232382&T=1

As an alternative you can also use a QR Code:  

The GUIDs for individual cells are displayed in the table below:

Estimated Parameters of Exponential Smoothing
ParameterValue
alpha0.752013114227701
beta0
gamma0.75899014078033


Interpolation Forecasts of Exponential Smoothing
tObservedFittedResiduals
13469.93463.7854460470086.14455395299166
14477.19475.5843066669381.60569333306182
15478.97478.4778012436960.492198756304276
16480.44480.228933296110.211066703889742
17480.56480.4286503582790.13134964172076
18481.8481.6900858109360.109914189063772
19483.24482.2462348554190.993765144580948
20483.45483.2570514094740.192948590526441
21483.53483.4135600794550.116439920544963
22483.59483.792533226258-0.202533226258424
23483.59483.803717716912-0.213717716912299
24483.59483.736074657252-0.146074657251972
25492.36485.2495755610117.11042443898873
26495.71496.920480916617-1.21048091661731
27499.29497.486594020331.80340597967023
28499.78500.170856537355-0.390856537355091
29500499.9029151146880.097084885312313
30500501.134548448816-1.13454844881596
31500.29500.921203343942-0.631203343941763
32500.42500.559292911867-0.139292911866562
33500.61500.4515511835950.158448816405496
34498.9500.802078572468-1.9020785724685
35499.06499.533077534176-0.473077534175559
36496.61499.283124240353-2.67312424035254
37498.41500.262066084364-1.85206608436403
38501.26503.626903541414-2.36690354141405
39505.4503.8906442558051.50935574419509
40506.07505.9407739233130.129226076687416
41506.2506.1557815869410.0442184130592977
42507.14507.115841105480.0241588945198714
43507.14507.868598533324-0.728598533324259
44507.28507.526032826993-0.246032826992916
45507.34507.394062112133-0.0540621121331242
46507.48507.1969468521370.283053147862915
47506.97507.840159529596-0.870159529595981
48506.97506.8775034538180.0924965461816782
49510.1510.0907676370850.00923236291532703
50515.84514.7584234350581.08157656494245
51519518.3450543910250.654945608974799
52520.1519.4928889760970.60711102390303
53521.26520.0512722785641.20872772143605
54521.04521.88328247406-0.843282474060402
55521.12521.842028913931-0.722028913931013
56521.12521.595231972407-0.475231972406846
57521.1521.327033145847-0.227033145846576
58521.16521.063293099960.0967069000398624
59521.14521.349313724853-0.209313724852791
60521.13521.0648131035390.0651868964613413
61522.17524.24186812069-2.07186812068983
62531.39527.5463452611753.84365473882508
63532.12533.129794917971-1.00979491797113
64533.34533.0167193884610.323280611539531
65535.72533.4748945535852.24510544641487
66536.25535.7000458486090.549954151391034
67536.25536.729346798791-0.479346798790516
68536.68536.711502012387-0.03150201238725
69536.76536.823709819127-0.0637098191266432
70536.79536.7437252791690.0462747208313203
71536.99536.9342211638970.0557788361028315
72536.99536.9007400224180.0892599775817189
73542.38539.6936626688932.68633733110653
74544.1547.689790063678-3.58979006367827
75546.96546.7696773855590.190322614441129
76547.04547.810016923763-0.770016923762796
77550.27547.807743108862.46225689113953
78550.32549.8771344371230.442865562876591
79551.17550.6321687498520.537831250148088
80552.83551.4635483629161.36645163708442
81552.35552.620973506596-0.27097350659551
82552.44552.4058252018230.0341747981774461
83552.47552.589010646822-0.119010646821835
84548.78552.430387329056-3.65038732905623

\begin{tabular}{lllllllll}
\hline
Interpolation Forecasts of Exponential Smoothing \tabularnewline
t & Observed & Fitted & Residuals \tabularnewline
13 & 469.93 & 463.785446047008 & 6.14455395299166 \tabularnewline
14 & 477.19 & 475.584306666938 & 1.60569333306182 \tabularnewline
15 & 478.97 & 478.477801243696 & 0.492198756304276 \tabularnewline
16 & 480.44 & 480.22893329611 & 0.211066703889742 \tabularnewline
17 & 480.56 & 480.428650358279 & 0.13134964172076 \tabularnewline
18 & 481.8 & 481.690085810936 & 0.109914189063772 \tabularnewline
19 & 483.24 & 482.246234855419 & 0.993765144580948 \tabularnewline
20 & 483.45 & 483.257051409474 & 0.192948590526441 \tabularnewline
21 & 483.53 & 483.413560079455 & 0.116439920544963 \tabularnewline
22 & 483.59 & 483.792533226258 & -0.202533226258424 \tabularnewline
23 & 483.59 & 483.803717716912 & -0.213717716912299 \tabularnewline
24 & 483.59 & 483.736074657252 & -0.146074657251972 \tabularnewline
25 & 492.36 & 485.249575561011 & 7.11042443898873 \tabularnewline
26 & 495.71 & 496.920480916617 & -1.21048091661731 \tabularnewline
27 & 499.29 & 497.48659402033 & 1.80340597967023 \tabularnewline
28 & 499.78 & 500.170856537355 & -0.390856537355091 \tabularnewline
29 & 500 & 499.902915114688 & 0.097084885312313 \tabularnewline
30 & 500 & 501.134548448816 & -1.13454844881596 \tabularnewline
31 & 500.29 & 500.921203343942 & -0.631203343941763 \tabularnewline
32 & 500.42 & 500.559292911867 & -0.139292911866562 \tabularnewline
33 & 500.61 & 500.451551183595 & 0.158448816405496 \tabularnewline
34 & 498.9 & 500.802078572468 & -1.9020785724685 \tabularnewline
35 & 499.06 & 499.533077534176 & -0.473077534175559 \tabularnewline
36 & 496.61 & 499.283124240353 & -2.67312424035254 \tabularnewline
37 & 498.41 & 500.262066084364 & -1.85206608436403 \tabularnewline
38 & 501.26 & 503.626903541414 & -2.36690354141405 \tabularnewline
39 & 505.4 & 503.890644255805 & 1.50935574419509 \tabularnewline
40 & 506.07 & 505.940773923313 & 0.129226076687416 \tabularnewline
41 & 506.2 & 506.155781586941 & 0.0442184130592977 \tabularnewline
42 & 507.14 & 507.11584110548 & 0.0241588945198714 \tabularnewline
43 & 507.14 & 507.868598533324 & -0.728598533324259 \tabularnewline
44 & 507.28 & 507.526032826993 & -0.246032826992916 \tabularnewline
45 & 507.34 & 507.394062112133 & -0.0540621121331242 \tabularnewline
46 & 507.48 & 507.196946852137 & 0.283053147862915 \tabularnewline
47 & 506.97 & 507.840159529596 & -0.870159529595981 \tabularnewline
48 & 506.97 & 506.877503453818 & 0.0924965461816782 \tabularnewline
49 & 510.1 & 510.090767637085 & 0.00923236291532703 \tabularnewline
50 & 515.84 & 514.758423435058 & 1.08157656494245 \tabularnewline
51 & 519 & 518.345054391025 & 0.654945608974799 \tabularnewline
52 & 520.1 & 519.492888976097 & 0.60711102390303 \tabularnewline
53 & 521.26 & 520.051272278564 & 1.20872772143605 \tabularnewline
54 & 521.04 & 521.88328247406 & -0.843282474060402 \tabularnewline
55 & 521.12 & 521.842028913931 & -0.722028913931013 \tabularnewline
56 & 521.12 & 521.595231972407 & -0.475231972406846 \tabularnewline
57 & 521.1 & 521.327033145847 & -0.227033145846576 \tabularnewline
58 & 521.16 & 521.06329309996 & 0.0967069000398624 \tabularnewline
59 & 521.14 & 521.349313724853 & -0.209313724852791 \tabularnewline
60 & 521.13 & 521.064813103539 & 0.0651868964613413 \tabularnewline
61 & 522.17 & 524.24186812069 & -2.07186812068983 \tabularnewline
62 & 531.39 & 527.546345261175 & 3.84365473882508 \tabularnewline
63 & 532.12 & 533.129794917971 & -1.00979491797113 \tabularnewline
64 & 533.34 & 533.016719388461 & 0.323280611539531 \tabularnewline
65 & 535.72 & 533.474894553585 & 2.24510544641487 \tabularnewline
66 & 536.25 & 535.700045848609 & 0.549954151391034 \tabularnewline
67 & 536.25 & 536.729346798791 & -0.479346798790516 \tabularnewline
68 & 536.68 & 536.711502012387 & -0.03150201238725 \tabularnewline
69 & 536.76 & 536.823709819127 & -0.0637098191266432 \tabularnewline
70 & 536.79 & 536.743725279169 & 0.0462747208313203 \tabularnewline
71 & 536.99 & 536.934221163897 & 0.0557788361028315 \tabularnewline
72 & 536.99 & 536.900740022418 & 0.0892599775817189 \tabularnewline
73 & 542.38 & 539.693662668893 & 2.68633733110653 \tabularnewline
74 & 544.1 & 547.689790063678 & -3.58979006367827 \tabularnewline
75 & 546.96 & 546.769677385559 & 0.190322614441129 \tabularnewline
76 & 547.04 & 547.810016923763 & -0.770016923762796 \tabularnewline
77 & 550.27 & 547.80774310886 & 2.46225689113953 \tabularnewline
78 & 550.32 & 549.877134437123 & 0.442865562876591 \tabularnewline
79 & 551.17 & 550.632168749852 & 0.537831250148088 \tabularnewline
80 & 552.83 & 551.463548362916 & 1.36645163708442 \tabularnewline
81 & 552.35 & 552.620973506596 & -0.27097350659551 \tabularnewline
82 & 552.44 & 552.405825201823 & 0.0341747981774461 \tabularnewline
83 & 552.47 & 552.589010646822 & -0.119010646821835 \tabularnewline
84 & 548.78 & 552.430387329056 & -3.65038732905623 \tabularnewline
\hline
\end{tabular}
%Source: https://freestatistics.org/blog/index.php?pk=232382&T=2

[TABLE]
[ROW][C]Interpolation Forecasts of Exponential Smoothing[/C][/ROW]
[ROW][C]t[/C][C]Observed[/C][C]Fitted[/C][C]Residuals[/C][/ROW]
[ROW][C]13[/C][C]469.93[/C][C]463.785446047008[/C][C]6.14455395299166[/C][/ROW]
[ROW][C]14[/C][C]477.19[/C][C]475.584306666938[/C][C]1.60569333306182[/C][/ROW]
[ROW][C]15[/C][C]478.97[/C][C]478.477801243696[/C][C]0.492198756304276[/C][/ROW]
[ROW][C]16[/C][C]480.44[/C][C]480.22893329611[/C][C]0.211066703889742[/C][/ROW]
[ROW][C]17[/C][C]480.56[/C][C]480.428650358279[/C][C]0.13134964172076[/C][/ROW]
[ROW][C]18[/C][C]481.8[/C][C]481.690085810936[/C][C]0.109914189063772[/C][/ROW]
[ROW][C]19[/C][C]483.24[/C][C]482.246234855419[/C][C]0.993765144580948[/C][/ROW]
[ROW][C]20[/C][C]483.45[/C][C]483.257051409474[/C][C]0.192948590526441[/C][/ROW]
[ROW][C]21[/C][C]483.53[/C][C]483.413560079455[/C][C]0.116439920544963[/C][/ROW]
[ROW][C]22[/C][C]483.59[/C][C]483.792533226258[/C][C]-0.202533226258424[/C][/ROW]
[ROW][C]23[/C][C]483.59[/C][C]483.803717716912[/C][C]-0.213717716912299[/C][/ROW]
[ROW][C]24[/C][C]483.59[/C][C]483.736074657252[/C][C]-0.146074657251972[/C][/ROW]
[ROW][C]25[/C][C]492.36[/C][C]485.249575561011[/C][C]7.11042443898873[/C][/ROW]
[ROW][C]26[/C][C]495.71[/C][C]496.920480916617[/C][C]-1.21048091661731[/C][/ROW]
[ROW][C]27[/C][C]499.29[/C][C]497.48659402033[/C][C]1.80340597967023[/C][/ROW]
[ROW][C]28[/C][C]499.78[/C][C]500.170856537355[/C][C]-0.390856537355091[/C][/ROW]
[ROW][C]29[/C][C]500[/C][C]499.902915114688[/C][C]0.097084885312313[/C][/ROW]
[ROW][C]30[/C][C]500[/C][C]501.134548448816[/C][C]-1.13454844881596[/C][/ROW]
[ROW][C]31[/C][C]500.29[/C][C]500.921203343942[/C][C]-0.631203343941763[/C][/ROW]
[ROW][C]32[/C][C]500.42[/C][C]500.559292911867[/C][C]-0.139292911866562[/C][/ROW]
[ROW][C]33[/C][C]500.61[/C][C]500.451551183595[/C][C]0.158448816405496[/C][/ROW]
[ROW][C]34[/C][C]498.9[/C][C]500.802078572468[/C][C]-1.9020785724685[/C][/ROW]
[ROW][C]35[/C][C]499.06[/C][C]499.533077534176[/C][C]-0.473077534175559[/C][/ROW]
[ROW][C]36[/C][C]496.61[/C][C]499.283124240353[/C][C]-2.67312424035254[/C][/ROW]
[ROW][C]37[/C][C]498.41[/C][C]500.262066084364[/C][C]-1.85206608436403[/C][/ROW]
[ROW][C]38[/C][C]501.26[/C][C]503.626903541414[/C][C]-2.36690354141405[/C][/ROW]
[ROW][C]39[/C][C]505.4[/C][C]503.890644255805[/C][C]1.50935574419509[/C][/ROW]
[ROW][C]40[/C][C]506.07[/C][C]505.940773923313[/C][C]0.129226076687416[/C][/ROW]
[ROW][C]41[/C][C]506.2[/C][C]506.155781586941[/C][C]0.0442184130592977[/C][/ROW]
[ROW][C]42[/C][C]507.14[/C][C]507.11584110548[/C][C]0.0241588945198714[/C][/ROW]
[ROW][C]43[/C][C]507.14[/C][C]507.868598533324[/C][C]-0.728598533324259[/C][/ROW]
[ROW][C]44[/C][C]507.28[/C][C]507.526032826993[/C][C]-0.246032826992916[/C][/ROW]
[ROW][C]45[/C][C]507.34[/C][C]507.394062112133[/C][C]-0.0540621121331242[/C][/ROW]
[ROW][C]46[/C][C]507.48[/C][C]507.196946852137[/C][C]0.283053147862915[/C][/ROW]
[ROW][C]47[/C][C]506.97[/C][C]507.840159529596[/C][C]-0.870159529595981[/C][/ROW]
[ROW][C]48[/C][C]506.97[/C][C]506.877503453818[/C][C]0.0924965461816782[/C][/ROW]
[ROW][C]49[/C][C]510.1[/C][C]510.090767637085[/C][C]0.00923236291532703[/C][/ROW]
[ROW][C]50[/C][C]515.84[/C][C]514.758423435058[/C][C]1.08157656494245[/C][/ROW]
[ROW][C]51[/C][C]519[/C][C]518.345054391025[/C][C]0.654945608974799[/C][/ROW]
[ROW][C]52[/C][C]520.1[/C][C]519.492888976097[/C][C]0.60711102390303[/C][/ROW]
[ROW][C]53[/C][C]521.26[/C][C]520.051272278564[/C][C]1.20872772143605[/C][/ROW]
[ROW][C]54[/C][C]521.04[/C][C]521.88328247406[/C][C]-0.843282474060402[/C][/ROW]
[ROW][C]55[/C][C]521.12[/C][C]521.842028913931[/C][C]-0.722028913931013[/C][/ROW]
[ROW][C]56[/C][C]521.12[/C][C]521.595231972407[/C][C]-0.475231972406846[/C][/ROW]
[ROW][C]57[/C][C]521.1[/C][C]521.327033145847[/C][C]-0.227033145846576[/C][/ROW]
[ROW][C]58[/C][C]521.16[/C][C]521.06329309996[/C][C]0.0967069000398624[/C][/ROW]
[ROW][C]59[/C][C]521.14[/C][C]521.349313724853[/C][C]-0.209313724852791[/C][/ROW]
[ROW][C]60[/C][C]521.13[/C][C]521.064813103539[/C][C]0.0651868964613413[/C][/ROW]
[ROW][C]61[/C][C]522.17[/C][C]524.24186812069[/C][C]-2.07186812068983[/C][/ROW]
[ROW][C]62[/C][C]531.39[/C][C]527.546345261175[/C][C]3.84365473882508[/C][/ROW]
[ROW][C]63[/C][C]532.12[/C][C]533.129794917971[/C][C]-1.00979491797113[/C][/ROW]
[ROW][C]64[/C][C]533.34[/C][C]533.016719388461[/C][C]0.323280611539531[/C][/ROW]
[ROW][C]65[/C][C]535.72[/C][C]533.474894553585[/C][C]2.24510544641487[/C][/ROW]
[ROW][C]66[/C][C]536.25[/C][C]535.700045848609[/C][C]0.549954151391034[/C][/ROW]
[ROW][C]67[/C][C]536.25[/C][C]536.729346798791[/C][C]-0.479346798790516[/C][/ROW]
[ROW][C]68[/C][C]536.68[/C][C]536.711502012387[/C][C]-0.03150201238725[/C][/ROW]
[ROW][C]69[/C][C]536.76[/C][C]536.823709819127[/C][C]-0.0637098191266432[/C][/ROW]
[ROW][C]70[/C][C]536.79[/C][C]536.743725279169[/C][C]0.0462747208313203[/C][/ROW]
[ROW][C]71[/C][C]536.99[/C][C]536.934221163897[/C][C]0.0557788361028315[/C][/ROW]
[ROW][C]72[/C][C]536.99[/C][C]536.900740022418[/C][C]0.0892599775817189[/C][/ROW]
[ROW][C]73[/C][C]542.38[/C][C]539.693662668893[/C][C]2.68633733110653[/C][/ROW]
[ROW][C]74[/C][C]544.1[/C][C]547.689790063678[/C][C]-3.58979006367827[/C][/ROW]
[ROW][C]75[/C][C]546.96[/C][C]546.769677385559[/C][C]0.190322614441129[/C][/ROW]
[ROW][C]76[/C][C]547.04[/C][C]547.810016923763[/C][C]-0.770016923762796[/C][/ROW]
[ROW][C]77[/C][C]550.27[/C][C]547.80774310886[/C][C]2.46225689113953[/C][/ROW]
[ROW][C]78[/C][C]550.32[/C][C]549.877134437123[/C][C]0.442865562876591[/C][/ROW]
[ROW][C]79[/C][C]551.17[/C][C]550.632168749852[/C][C]0.537831250148088[/C][/ROW]
[ROW][C]80[/C][C]552.83[/C][C]551.463548362916[/C][C]1.36645163708442[/C][/ROW]
[ROW][C]81[/C][C]552.35[/C][C]552.620973506596[/C][C]-0.27097350659551[/C][/ROW]
[ROW][C]82[/C][C]552.44[/C][C]552.405825201823[/C][C]0.0341747981774461[/C][/ROW]
[ROW][C]83[/C][C]552.47[/C][C]552.589010646822[/C][C]-0.119010646821835[/C][/ROW]
[ROW][C]84[/C][C]548.78[/C][C]552.430387329056[/C][C]-3.65038732905623[/C][/ROW]
[/TABLE]
Source: https://freestatistics.org/blog/index.php?pk=232382&T=2

Globally Unique Identifier (entire table): ba.freestatistics.org/blog/index.php?pk=232382&T=2

As an alternative you can also use a QR Code:  

The GUIDs for individual cells are displayed in the table below:

Interpolation Forecasts of Exponential Smoothing
tObservedFittedResiduals
13469.93463.7854460470086.14455395299166
14477.19475.5843066669381.60569333306182
15478.97478.4778012436960.492198756304276
16480.44480.228933296110.211066703889742
17480.56480.4286503582790.13134964172076
18481.8481.6900858109360.109914189063772
19483.24482.2462348554190.993765144580948
20483.45483.2570514094740.192948590526441
21483.53483.4135600794550.116439920544963
22483.59483.792533226258-0.202533226258424
23483.59483.803717716912-0.213717716912299
24483.59483.736074657252-0.146074657251972
25492.36485.2495755610117.11042443898873
26495.71496.920480916617-1.21048091661731
27499.29497.486594020331.80340597967023
28499.78500.170856537355-0.390856537355091
29500499.9029151146880.097084885312313
30500501.134548448816-1.13454844881596
31500.29500.921203343942-0.631203343941763
32500.42500.559292911867-0.139292911866562
33500.61500.4515511835950.158448816405496
34498.9500.802078572468-1.9020785724685
35499.06499.533077534176-0.473077534175559
36496.61499.283124240353-2.67312424035254
37498.41500.262066084364-1.85206608436403
38501.26503.626903541414-2.36690354141405
39505.4503.8906442558051.50935574419509
40506.07505.9407739233130.129226076687416
41506.2506.1557815869410.0442184130592977
42507.14507.115841105480.0241588945198714
43507.14507.868598533324-0.728598533324259
44507.28507.526032826993-0.246032826992916
45507.34507.394062112133-0.0540621121331242
46507.48507.1969468521370.283053147862915
47506.97507.840159529596-0.870159529595981
48506.97506.8775034538180.0924965461816782
49510.1510.0907676370850.00923236291532703
50515.84514.7584234350581.08157656494245
51519518.3450543910250.654945608974799
52520.1519.4928889760970.60711102390303
53521.26520.0512722785641.20872772143605
54521.04521.88328247406-0.843282474060402
55521.12521.842028913931-0.722028913931013
56521.12521.595231972407-0.475231972406846
57521.1521.327033145847-0.227033145846576
58521.16521.063293099960.0967069000398624
59521.14521.349313724853-0.209313724852791
60521.13521.0648131035390.0651868964613413
61522.17524.24186812069-2.07186812068983
62531.39527.5463452611753.84365473882508
63532.12533.129794917971-1.00979491797113
64533.34533.0167193884610.323280611539531
65535.72533.4748945535852.24510544641487
66536.25535.7000458486090.549954151391034
67536.25536.729346798791-0.479346798790516
68536.68536.711502012387-0.03150201238725
69536.76536.823709819127-0.0637098191266432
70536.79536.7437252791690.0462747208313203
71536.99536.9342211638970.0557788361028315
72536.99536.9007400224180.0892599775817189
73542.38539.6936626688932.68633733110653
74544.1547.689790063678-3.58979006367827
75546.96546.7696773855590.190322614441129
76547.04547.810016923763-0.770016923762796
77550.27547.807743108862.46225689113953
78550.32549.8771344371230.442865562876591
79551.17550.6321687498520.537831250148088
80552.83551.4635483629161.36645163708442
81552.35552.620973506596-0.27097350659551
82552.44552.4058252018230.0341747981774461
83552.47552.589010646822-0.119010646821835
84548.78552.430387329056-3.65038732905623


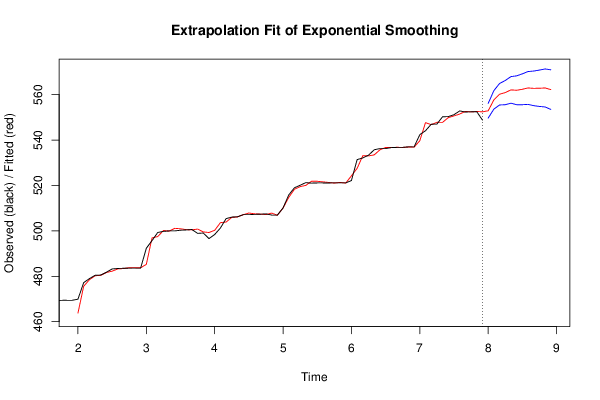
Extrapolation Forecasts of Exponential Smoothing
tForecast95% Lower Bound95% Upper Bound
85552.899867022493549.654636821613556.145097223374
86557.694543318816553.634082392675561.755004244957
87560.185491147218555.448069189155564.922913105281
88560.901950858393555.57288051876566.231021198025
89562.087117157213556.22581913026567.948415184166
90561.924769981978555.575704032031568.273835931925
91562.364637987383555.56269250739569.166583467376
92562.947524045989555.721025157259570.174022934718
93562.769164130849555.141706489877570.396621771821
94562.815226348919554.806859852508570.82359284533
95562.943879394124554.571916791672571.315841996575
96562.210079332175553.489667547582570.930491116768

\begin{tabular}{lllllllll}
\hline
Extrapolation Forecasts of Exponential Smoothing \tabularnewline
t & Forecast & 95% Lower Bound & 95% Upper Bound \tabularnewline
85 & 552.899867022493 & 549.654636821613 & 556.145097223374 \tabularnewline
86 & 557.694543318816 & 553.634082392675 & 561.755004244957 \tabularnewline
87 & 560.185491147218 & 555.448069189155 & 564.922913105281 \tabularnewline
88 & 560.901950858393 & 555.57288051876 & 566.231021198025 \tabularnewline
89 & 562.087117157213 & 556.22581913026 & 567.948415184166 \tabularnewline
90 & 561.924769981978 & 555.575704032031 & 568.273835931925 \tabularnewline
91 & 562.364637987383 & 555.56269250739 & 569.166583467376 \tabularnewline
92 & 562.947524045989 & 555.721025157259 & 570.174022934718 \tabularnewline
93 & 562.769164130849 & 555.141706489877 & 570.396621771821 \tabularnewline
94 & 562.815226348919 & 554.806859852508 & 570.82359284533 \tabularnewline
95 & 562.943879394124 & 554.571916791672 & 571.315841996575 \tabularnewline
96 & 562.210079332175 & 553.489667547582 & 570.930491116768 \tabularnewline
\hline
\end{tabular}
%Source: https://freestatistics.org/blog/index.php?pk=232382&T=3

[TABLE]
[ROW][C]Extrapolation Forecasts of Exponential Smoothing[/C][/ROW]
[ROW][C]t[/C][C]Forecast[/C][C]95% Lower Bound[/C][C]95% Upper Bound[/C][/ROW]
[ROW][C]85[/C][C]552.899867022493[/C][C]549.654636821613[/C][C]556.145097223374[/C][/ROW]
[ROW][C]86[/C][C]557.694543318816[/C][C]553.634082392675[/C][C]561.755004244957[/C][/ROW]
[ROW][C]87[/C][C]560.185491147218[/C][C]555.448069189155[/C][C]564.922913105281[/C][/ROW]
[ROW][C]88[/C][C]560.901950858393[/C][C]555.57288051876[/C][C]566.231021198025[/C][/ROW]
[ROW][C]89[/C][C]562.087117157213[/C][C]556.22581913026[/C][C]567.948415184166[/C][/ROW]
[ROW][C]90[/C][C]561.924769981978[/C][C]555.575704032031[/C][C]568.273835931925[/C][/ROW]
[ROW][C]91[/C][C]562.364637987383[/C][C]555.56269250739[/C][C]569.166583467376[/C][/ROW]
[ROW][C]92[/C][C]562.947524045989[/C][C]555.721025157259[/C][C]570.174022934718[/C][/ROW]
[ROW][C]93[/C][C]562.769164130849[/C][C]555.141706489877[/C][C]570.396621771821[/C][/ROW]
[ROW][C]94[/C][C]562.815226348919[/C][C]554.806859852508[/C][C]570.82359284533[/C][/ROW]
[ROW][C]95[/C][C]562.943879394124[/C][C]554.571916791672[/C][C]571.315841996575[/C][/ROW]
[ROW][C]96[/C][C]562.210079332175[/C][C]553.489667547582[/C][C]570.930491116768[/C][/ROW]
[/TABLE]
Source: https://freestatistics.org/blog/index.php?pk=232382&T=3

Globally Unique Identifier (entire table): ba.freestatistics.org/blog/index.php?pk=232382&T=3

As an alternative you can also use a QR Code:  

The GUIDs for individual cells are displayed in the table below:

Extrapolation Forecasts of Exponential Smoothing
tForecast95% Lower Bound95% Upper Bound
85552.899867022493549.654636821613556.145097223374
86557.694543318816553.634082392675561.755004244957
87560.185491147218555.448069189155564.922913105281
88560.901950858393555.57288051876566.231021198025
89562.087117157213556.22581913026567.948415184166
90561.924769981978555.575704032031568.273835931925
91562.364637987383555.56269250739569.166583467376
92562.947524045989555.721025157259570.174022934718
93562.769164130849555.141706489877570.396621771821
94562.815226348919554.806859852508570.82359284533
95562.943879394124554.571916791672571.315841996575
96562.210079332175553.489667547582570.930491116768


Parameters (Session):
par1 = 12 ; par2 = Triple ; par3 = additive ;
Parameters (R input):
par1 = 12 ; par2 = Triple ; par3 = additive ;
R code (references can be found in the software module):
par1 <- as.numeric(par1)
if (par2 == 'Single') K <- 1
if (par2 == 'Double') K <- 2
if (par2 == 'Triple') K <- par1
nx <- length(x)
nxmK <- nx - K
x <- ts(x, frequency = par1)
if (par2 == 'Single') fit <- HoltWinters(x, gamma=F, beta=F)
if (par2 == 'Double') fit <- HoltWinters(x, gamma=F)
if (par2 == 'Triple') fit <- HoltWinters(x, seasonal=par3)
fit
myresid <- x - fit$fitted[,'xhat']
bitmap(file='test1.png')
op <- par(mfrow=c(2,1))
plot(fit,ylab='Observed (black) / Fitted (red)',main='Interpolation Fit of Exponential Smoothing')
plot(myresid,ylab='Residuals',main='Interpolation Prediction Errors')
par(op)
dev.off()
bitmap(file='test2.png')
p <- predict(fit, par1, prediction.interval=TRUE)
np <- length(p[,1])
plot(fit,p,ylab='Observed (black) / Fitted (red)',main='Extrapolation Fit of Exponential Smoothing')
dev.off()
bitmap(file='test3.png')
op <- par(mfrow = c(2,2))
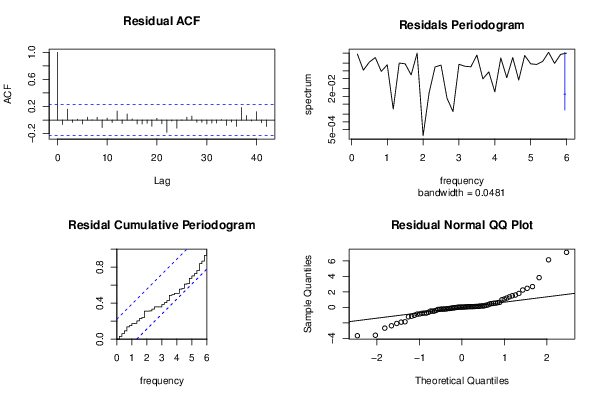
acf(as.numeric(myresid),lag.max = nx/2,main='Residual ACF')
spectrum(myresid,main='Residals Periodogram')
cpgram(myresid,main='Residal Cumulative Periodogram')
qqnorm(myresid,main='Residual Normal QQ Plot')
qqline(myresid)
par(op)
dev.off()
load(file='createtable')
a<-table.start()
a<-table.row.start(a)
a<-table.element(a,'Estimated Parameters of Exponential Smoothing',2,TRUE)
a<-table.row.end(a)
a<-table.row.start(a)
a<-table.element(a,'Parameter',header=TRUE)
a<-table.element(a,'Value',header=TRUE)
a<-table.row.end(a)
a<-table.row.start(a)
a<-table.element(a,'alpha',header=TRUE)
a<-table.element(a,fit$alpha)
a<-table.row.end(a)
a<-table.row.start(a)
a<-table.element(a,'beta',header=TRUE)
a<-table.element(a,fit$beta)
a<-table.row.end(a)
a<-table.row.start(a)
a<-table.element(a,'gamma',header=TRUE)
a<-table.element(a,fit$gamma)
a<-table.row.end(a)
a<-table.end(a)
table.save(a,file='mytable.tab')
a<-table.start()
a<-table.row.start(a)
a<-table.element(a,'Interpolation Forecasts of Exponential Smoothing',4,TRUE)
a<-table.row.end(a)
a<-table.row.start(a)
a<-table.element(a,'t',header=TRUE)
a<-table.element(a,'Observed',header=TRUE)
a<-table.element(a,'Fitted',header=TRUE)
a<-table.element(a,'Residuals',header=TRUE)
a<-table.row.end(a)
for (i in 1:nxmK) {
a<-table.row.start(a)
a<-table.element(a,i+K,header=TRUE)
a<-table.element(a,x[i+K])
a<-table.element(a,fit$fitted[i,'xhat'])
a<-table.element(a,myresid[i])
a<-table.row.end(a)
}
a<-table.end(a)
table.save(a,file='mytable1.tab')
a<-table.start()
a<-table.row.start(a)
a<-table.element(a,'Extrapolation Forecasts of Exponential Smoothing',4,TRUE)
a<-table.row.end(a)
a<-table.row.start(a)
a<-table.element(a,'t',header=TRUE)
a<-table.element(a,'Forecast',header=TRUE)
a<-table.element(a,'95% Lower Bound',header=TRUE)
a<-table.element(a,'95% Upper Bound',header=TRUE)
a<-table.row.end(a)
for (i in 1:np) {
a<-table.row.start(a)
a<-table.element(a,nx+i,header=TRUE)
a<-table.element(a,p[i,'fit'])
a<-table.element(a,p[i,'lwr'])
a<-table.element(a,p[i,'upr'])
a<-table.row.end(a)
}
a<-table.end(a)
table.save(a,file='mytable2.tab')