| Correlations for all pairs of data series (method=kendall) | |||||
| walking.days | cycling.days | sports.days | fruits | vegetables | |
| walking.days | 1 | 0.107 | 0.228 | 0.036 | 0.044 |
| cycling.days | 0.107 | 1 | 0.1 | 0.024 | 0.047 |
| sports.days | 0.228 | 0.1 | 1 | 0.084 | 0.063 |
| fruits | 0.036 | 0.024 | 0.084 | 1 | 0.379 |
| vegetables | 0.044 | 0.047 | 0.063 | 0.379 | 1 |
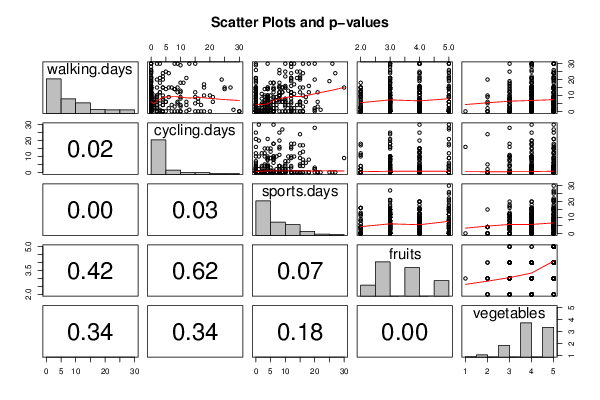
| Correlations for all pairs of data series with p-values | |||
| pair | Pearson r | Spearman rho | Kendall tau |
| walking.days;cycling.days | 0.0888 | 0.1348 | 0.1067 |
| p-value | (0.1249) | (0.0195) | (0.0179) |
| walking.days;sports.days | 0.3272 | 0.2963 | 0.2282 |
| p-value | (0) | (0) | (0) |
| walking.days;fruits | 0.0864 | 0.0467 | 0.0365 |
| p-value | (0.1352) | (0.4198) | (0.4235) |
| walking.days;vegetables | 0.071 | 0.0541 | 0.0441 |
| p-value | (0.2204) | (0.3502) | (0.3442) |
| cycling.days;sports.days | 0.1013 | 0.1273 | 0.1 |
| p-value | (0.0797) | (0.0275) | (0.0272) |
| cycling.days;fruits | 0.0603 | 0.029 | 0.0242 |
| p-value | (0.2979) | (0.6172) | (0.621) |
| cycling.days;vegetables | 0.0028 | 0.0544 | 0.0474 |
| p-value | (0.9619) | (0.3478) | (0.3419) |
| sports.days;fruits | 0.1444 | 0.1064 | 0.0841 |
| p-value | (0.0123) | (0.0657) | (0.0664) |
| sports.days;vegetables | 0.116 | 0.0767 | 0.0625 |
| p-value | (0.0448) | (0.185) | (0.1814) |
| fruits;vegetables | 0.4129 | 0.4238 | 0.3788 |
| p-value | (0) | (0) | (0) |
| Meta Analysis of Correlation Tests | |||
| Number of significant by total number of Correlations | |||
| Type I error | Pearson r | Spearman rho | Kendall tau |
| 0.01 | 0.2 | 0.2 | 0.2 |
| 0.02 | 0.3 | 0.3 | 0.3 |
| 0.03 | 0.3 | 0.4 | 0.4 |
| 0.04 | 0.3 | 0.4 | 0.4 |
| 0.05 | 0.4 | 0.4 | 0.4 |
| 0.06 | 0.4 | 0.4 | 0.4 |
| 0.07 | 0.4 | 0.5 | 0.5 |
| 0.08 | 0.5 | 0.5 | 0.5 |
| 0.09 | 0.5 | 0.5 | 0.5 |
| 0.1 | 0.5 | 0.5 | 0.5 |