| Tabulation of Results | ||
| hours x country | ||
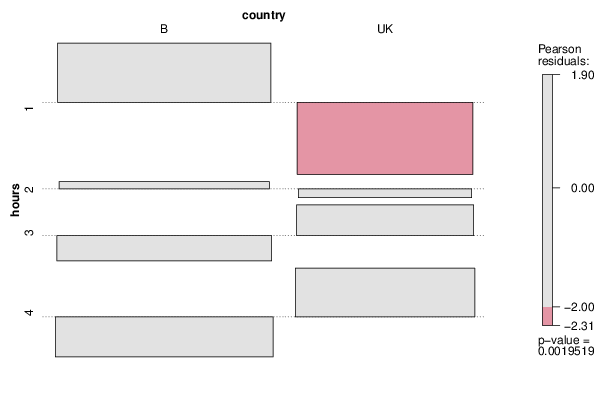
| B | UK | 1 | 54 | 16 | 2 | 42 | 26 | 3 | 37 | 34 | 4 | 35 | 38 |
| Tabulation of Expected Results | ||
| hours x country | ||
| B | UK | 1 | 41.7 | 28.3 | 2 | 40.51 | 27.49 | 3 | 42.3 | 28.7 | 4 | 43.49 | 29.51 |
| Statistical Results | |
| Pearson's Chi-squared test | |
| Pearson Chi Square Statistic | 14.85 |
| Degrees of Freedom | 3 |
| P value | 0 |