| Multiple Linear Regression - Estimated Regression Equation |
| HPC[t] = + 15561.9 -338.956Dummies1[t] -203.848Dummies2[t] -2176.45M1[t] -2905.72M2[t] -1557.56M3[t] -2304.26M4[t] -1743.38M5[t] -2416.94M6[t] -2455.37M7[t] -2140.78M8[t] -2935.62M9[t] -2186.17M10[t] -2524.01M11[t] + 80.8393t + e[t] |
| Multiple Linear Regression - Ordinary Least Squares | |||||
| Variable | Parameter | S.D. | T-STAT H0: parameter = 0 | 2-tail p-value | 1-tail p-value |
| (Intercept) | 15561.9 | 140.078 | 111.1 | 1.53514e-79 | 7.6757e-80 |
| Dummies1 | -338.956 | 321.595 | -1.054 | 0.295568 | 0.147784 |
| Dummies2 | -203.848 | 120.72 | -1.689 | 0.0958113 | 0.0479056 |
| M1 | -2176.45 | 164.4 | -13.24 | 1.28748e-20 | 6.4374e-21 |
| M2 | -2905.72 | 164.208 | -17.7 | 2.38199e-27 | 1.191e-27 |
| M3 | -1557.56 | 164.049 | -9.494 | 3.78664e-14 | 1.89332e-14 |
| M4 | -2304.26 | 163.926 | -14.06 | 6.20127e-22 | 3.10063e-22 |
| M5 | -1743.38 | 163.837 | -10.64 | 3.38444e-16 | 1.69222e-16 |
| M6 | -2416.94 | 163.782 | -14.76 | 4.94534e-23 | 2.47267e-23 |
| M7 | -2455.37 | 163.614 | -15.01 | 2.03532e-23 | 1.01766e-23 |
| M8 | -2140.78 | 163.422 | -13.1 | 2.17457e-20 | 1.08728e-20 |
| M9 | -2935.62 | 163.265 | -17.98 | 9.59025e-28 | 4.79513e-28 |
| M10 | -2186.17 | 163.142 | -13.4 | 7.02111e-21 | 3.51055e-21 |
| M11 | -2524.01 | 163.053 | -15.48 | 3.88437e-24 | 1.94219e-24 |
| t | 80.8393 | 2.38284 | 33.93 | 9.01111e-45 | 4.50555e-45 |
| Multiple Linear Regression - Regression Statistics | |
| Multiple R | 0.991758 |
| R-squared | 0.983585 |
| Adjusted R-squared | 0.980254 |
| F-TEST (value) | 295.317 |
| F-TEST (DF numerator) | 14 |
| F-TEST (DF denominator) | 69 |
| p-value | 0 |
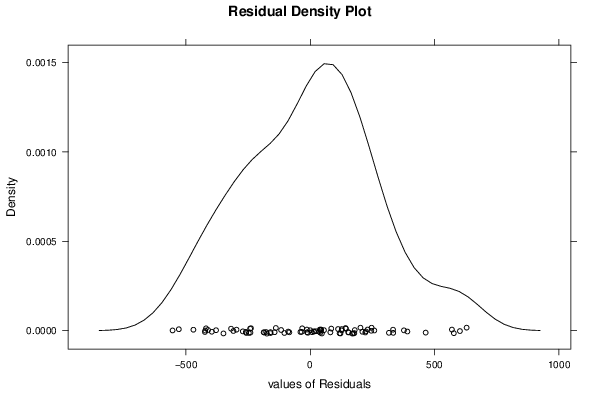
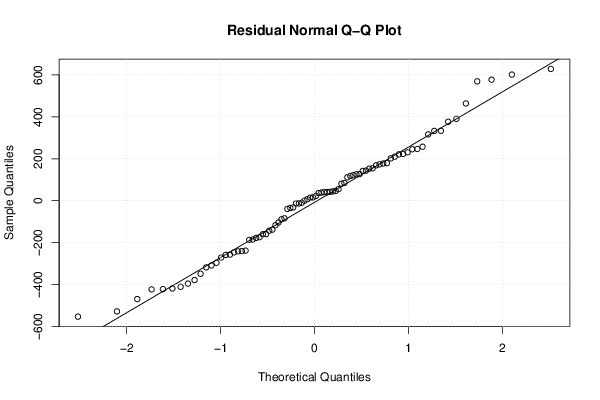
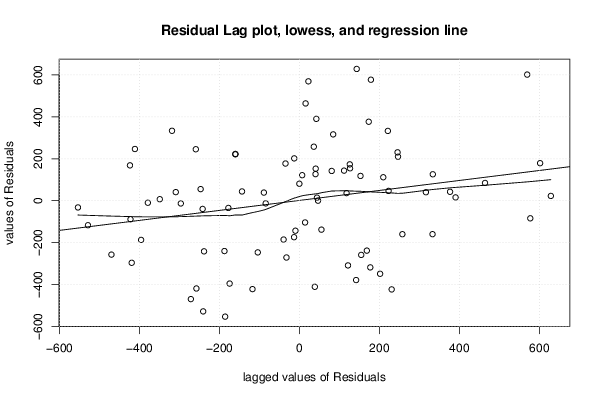
| Multiple Linear Regression - Residual Statistics | |
| Residual Standard Deviation | 292.582 |
| Sum Squared Residuals | 5906690 |
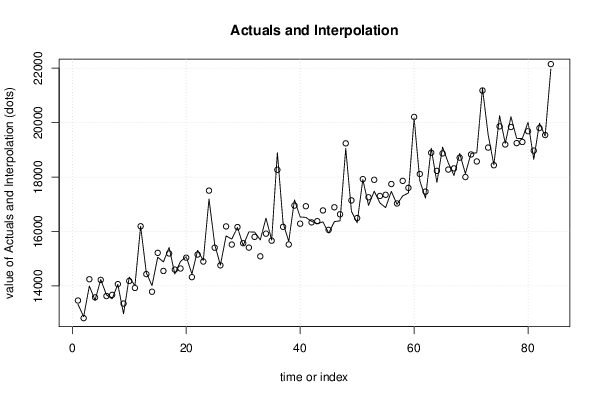
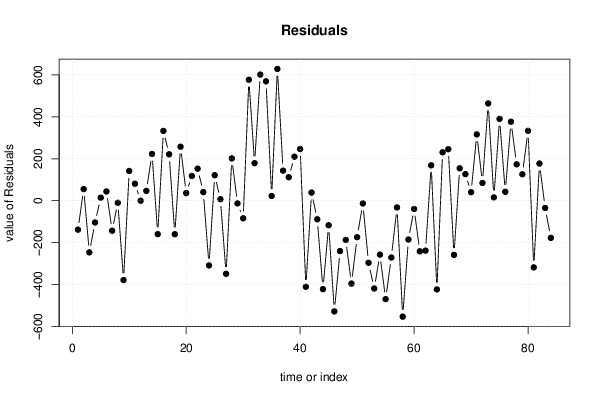
| Multiple Linear Regression - Actuals, Interpolation, and Residuals | |||
| Time or Index | Actuals | Interpolation Forecast | Residuals Prediction Error |
| 1 | 13328 | 13466.3 | -138.269 |
| 2 | 12873 | 12817.8 | 55.1592 |
| 3 | 14000 | 14246.8 | -246.841 |
| 4 | 13477 | 13581 | -103.984 |
| 5 | 14237 | 14222.7 | 14.302 |
| 6 | 13674 | 13630 | 44.0163 |
| 7 | 13529 | 13672.4 | -143.39 |
| 8 | 14058 | 14067.8 | -9.81904 |
| 9 | 12975 | 13353.8 | -378.819 |
| 10 | 14326 | 14184.1 | 141.895 |
| 11 | 14008 | 13927.1 | 80.8952 |
| 12 | 16193 | 16193 | 4.51635e-15 |
| 13 | 14483 | 14436.3 | 46.659 |
| 14 | 14011 | 13787.9 | 223.088 |
| 15 | 15057 | 15216.9 | -159.912 |
| 16 | 14884 | 14551.1 | 332.945 |
| 17 | 15414 | 15192.8 | 221.23 |
| 18 | 14440 | 14600.1 | -160.055 |
| 19 | 14900 | 14642.5 | 257.538 |
| 20 | 15074 | 15037.9 | 36.1093 |
| 21 | 14442 | 14323.9 | 118.109 |
| 22 | 15307 | 15154.2 | 152.824 |
| 23 | 14938 | 14897.2 | 40.8236 |
| 24 | 17193 | 17502 | -309.027 |
| 25 | 15528 | 15406.4 | 121.587 |
| 26 | 14765 | 14758 | 7.0159 |
| 27 | 15838 | 16187 | -348.984 |
| 28 | 15723 | 15521.1 | 201.873 |
| 29 | 16150 | 16162.8 | -12.8412 |
| 30 | 15486 | 15570.1 | -84.127 |
| 31 | 15986 | 15408.7 | 577.314 |
| 32 | 15983 | 15804.1 | 178.885 |
| 33 | 15692 | 15090.1 | 601.885 |
| 34 | 16490 | 15920.4 | 569.6 |
| 35 | 15686 | 15663.4 | 22.5995 |
| 36 | 18897 | 18268.3 | 628.749 |
| 37 | 16316 | 16172.6 | 143.363 |
| 38 | 15636 | 15524.2 | 111.792 |
| 39 | 17163 | 16953.2 | 209.792 |
| 40 | 16534 | 16287.4 | 246.649 |
| 41 | 16518 | 16929.1 | -411.065 |
| 42 | 16375 | 16336.4 | 38.6489 |
| 43 | 16290 | 16378.8 | -88.7578 |
| 44 | 16352 | 16774.2 | -422.186 |
| 45 | 15943 | 16060.2 | -117.186 |
| 46 | 16362 | 16890.5 | -528.472 |
| 47 | 16393 | 16633.5 | -240.472 |
| 48 | 19051 | 19238.3 | -187.323 |
| 49 | 16747 | 17142.7 | -395.708 |
| 50 | 16320 | 16494.3 | -174.28 |
| 51 | 17910 | 17923.3 | -13.2798 |
| 52 | 16961 | 17257.4 | -296.423 |
| 53 | 17480 | 17899.1 | -419.137 |
| 54 | 17049 | 17306.4 | -257.423 |
| 55 | 16879 | 17348.8 | -469.829 |
| 56 | 17473 | 17744.3 | -271.258 |
| 57 | 16998 | 17030.3 | -32.2581 |
| 58 | 17307 | 17860.5 | -553.544 |
| 59 | 17418 | 17603.5 | -185.544 |
| 60 | 20169 | 20208.4 | -39.3946 |
| 61 | 17871 | 18112.8 | -241.78 |
| 62 | 17226 | 17464.4 | -238.351 |
| 63 | 19062 | 18893.4 | 168.649 |
| 64 | 17804 | 18227.5 | -423.494 |
| 65 | 19100 | 18869.2 | 230.791 |
| 66 | 18522 | 18276.5 | 245.506 |
| 67 | 18060 | 18318.9 | -258.901 |
| 68 | 18869 | 18714.3 | 154.67 |
| 69 | 18127 | 18000.3 | 126.67 |
| 70 | 18871 | 18830.6 | 40.3846 |
| 71 | 18890 | 18573.6 | 316.385 |
| 72 | 21263 | 21178.5 | 84.5338 |
| 73 | 19547 | 19082.9 | 464.148 |
| 74 | 18450 | 18434.4 | 15.5769 |
| 75 | 20254 | 19863.4 | 390.577 |
| 76 | 19240 | 19197.6 | 42.434 |
| 77 | 20216 | 19839.3 | 376.72 |
| 78 | 19420 | 19246.6 | 173.434 |
| 79 | 19415 | 19289 | 126.027 |
| 80 | 20018 | 19684.4 | 333.599 |
| 81 | 18652 | 18970.4 | -318.401 |
| 82 | 19978 | 19800.7 | 177.313 |
| 83 | 19509 | 19543.7 | -34.6871 |
| 84 | 21971 | 22148.5 | -177.538 |
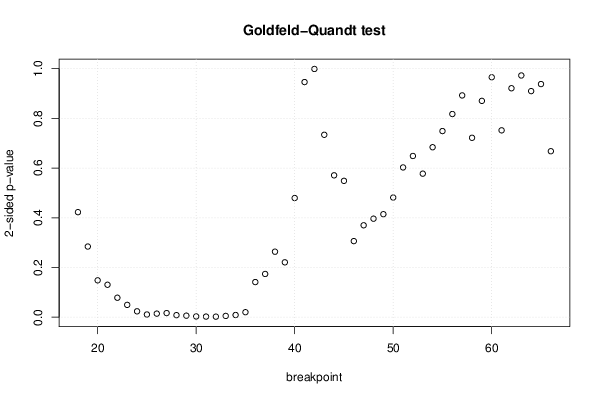
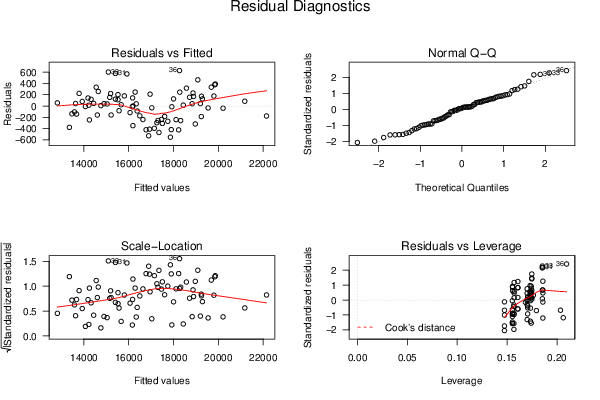
| Goldfeld-Quandt test for Heteroskedasticity | |||
| p-values | Alternative Hypothesis | ||
| breakpoint index | greater | 2-sided | less |
| 18 | 0.211261 | 0.422521 | 0.788739 |
| 19 | 0.142105 | 0.28421 | 0.857895 |
| 20 | 0.074135 | 0.14827 | 0.925865 |
| 21 | 0.0652703 | 0.130541 | 0.93473 |
| 22 | 0.039146 | 0.078292 | 0.960854 |
| 23 | 0.0248024 | 0.0496048 | 0.975198 |
| 24 | 0.0118815 | 0.0237629 | 0.988119 |
| 25 | 0.00546383 | 0.0109277 | 0.994536 |
| 26 | 0.0071898 | 0.0143796 | 0.99281 |
| 27 | 0.00827501 | 0.01655 | 0.991725 |
| 28 | 0.00416847 | 0.00833694 | 0.995832 |
| 29 | 0.00310378 | 0.00620755 | 0.996896 |
| 30 | 0.0015533 | 0.00310661 | 0.998447 |
| 31 | 0.00125845 | 0.0025169 | 0.998742 |
| 32 | 0.00112253 | 0.00224505 | 0.998877 |
| 33 | 0.0025907 | 0.0051814 | 0.997409 |
| 34 | 0.00442093 | 0.00884186 | 0.995579 |
| 35 | 0.0101013 | 0.0202027 | 0.989899 |
| 36 | 0.0706692 | 0.141338 | 0.929331 |
| 37 | 0.0869521 | 0.173904 | 0.913048 |
| 38 | 0.131716 | 0.263433 | 0.868284 |
| 39 | 0.110389 | 0.220777 | 0.889611 |
| 40 | 0.23966 | 0.479321 | 0.76034 |
| 41 | 0.527144 | 0.945712 | 0.472856 |
| 42 | 0.500761 | 0.998478 | 0.499239 |
| 43 | 0.633142 | 0.733715 | 0.366858 |
| 44 | 0.714656 | 0.570688 | 0.285344 |
| 45 | 0.725795 | 0.54841 | 0.274205 |
| 46 | 0.846956 | 0.306088 | 0.153044 |
| 47 | 0.815153 | 0.369694 | 0.184847 |
| 48 | 0.801888 | 0.396224 | 0.198112 |
| 49 | 0.792846 | 0.414309 | 0.207154 |
| 50 | 0.759352 | 0.481297 | 0.240648 |
| 51 | 0.698831 | 0.602337 | 0.301169 |
| 52 | 0.675787 | 0.648426 | 0.324213 |
| 53 | 0.711344 | 0.577312 | 0.288656 |
| 54 | 0.658196 | 0.683609 | 0.341804 |
| 55 | 0.625688 | 0.748625 | 0.374312 |
| 56 | 0.591418 | 0.817165 | 0.408582 |
| 57 | 0.554003 | 0.891994 | 0.445997 |
| 58 | 0.639226 | 0.721549 | 0.360774 |
| 59 | 0.564964 | 0.870071 | 0.435036 |
| 60 | 0.482561 | 0.965121 | 0.517439 |
| 61 | 0.624201 | 0.751599 | 0.375799 |
| 62 | 0.539578 | 0.920844 | 0.460422 |
| 63 | 0.486098 | 0.972196 | 0.513902 |
| 64 | 0.545321 | 0.909357 | 0.454679 |
| 65 | 0.468874 | 0.937749 | 0.531126 |
| 66 | 0.333802 | 0.667604 | 0.666198 |
| Meta Analysis of Goldfeld-Quandt test for Heteroskedasticity | |||
| Description | # significant tests | % significant tests | OK/NOK |
| 1% type I error level | 7 | 0.142857 | NOK |
| 5% type I error level | 13 | 0.265306 | NOK |
| 10% type I error level | 14 | 0.285714 | NOK |