| Pearson Product Moment Correlation - Ungrouped Data | ||
| Statistic | Variable X | Variable Y |
| Mean | 1309.15107913669 | 844.503597122302 |
| Biased Variance | 45390.7181822887 | 12936.8686920967 |
| Biased Standard Deviation | 213.050975548784 | 113.740356479557 |
| Covariance | 18734.6480033365 | |
| Correlation | 0.767558899807277 | |
| Determination | 0.589146664673358 | |
| T-Test | 14.0161451635828 | |
| p-value (2 sided) | 0 | |
| p-value (1 sided) | 0 | |
| Degrees of Freedom | 137 | |
| Number of Observations | 139 | |
| Normality Tests |
> jarque.x Jarque-Bera Normality Test data: x JB = 419.9623, p-value < 2.2e-16 alternative hypothesis: greater |
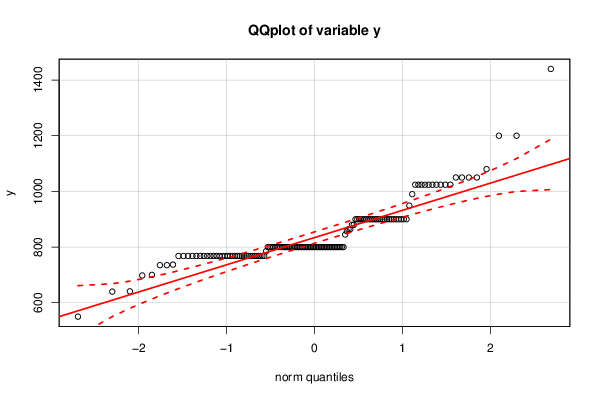
> jarque.y Jarque-Bera Normality Test data: y JB = 227.1755, p-value < 2.2e-16 alternative hypothesis: greater |
> ad.x Anderson-Darling normality test data: x A = 6.5958, p-value = 2.975e-16 |
> ad.y Anderson-Darling normality test data: y A = 9.1099, p-value < 2.2e-16 |