| Pearson Product Moment Correlation - Ungrouped Data | ||
| Statistic | Variable X | Variable Y |
| Mean | 6.58703703703704 | 0.741851851851852 |
| Biased Variance | 0.206683813443073 | 0.00984349657064472 |
| Biased Standard Deviation | 0.454624915114727 | 0.099214396992799 |
| Covariance | -0.0119151642208246 | |
| Correlation | -0.259271160761967 | |
| Determination | 0.0672215348028579 | |
| T-Test | -1.93582738068148 | |
| p-value (2 sided) | 0.0583339754485304 | |
| p-value (1 sided) | 0.0291669877242652 | |
| 95% CI of Correlation | [-0.492818947017149, 0.00912271552333516] | |
| Degrees of Freedom | 52 | |
| Number of Observations | 54 | |
| Normality Tests |
> jarque.x Jarque-Bera Normality Test data: x JB = 1.4138, p-value = 0.4932 alternative hypothesis: greater |
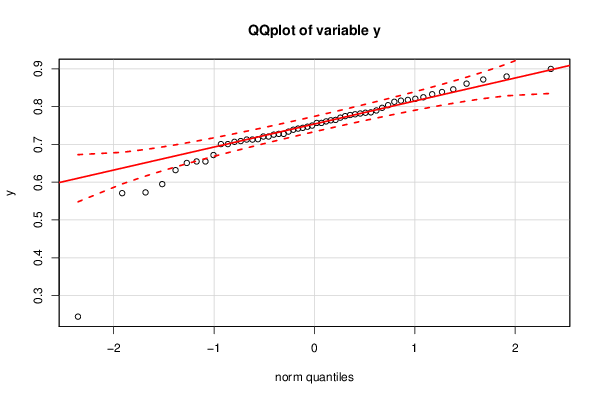
> jarque.y Jarque-Bera Normality Test data: y JB = 256.81, p-value < 2.2e-16 alternative hypothesis: greater |
> ad.x Anderson-Darling normality test data: x A = 0.5451, p-value = 0.154 |
> ad.y Anderson-Darling normality test data: y A = 1.693, p-value = 0.0002121 |