| Multiple Linear Regression - Estimated Regression Equation |
| TVDC[t] = + 6.02325 + 0.649713SK1[t] + 1.20144SK2[t] -0.0140394SK3[t] + 0.462548SK4[t] + 0.161402SK5[t] -0.022023SK6[t] -0.137479G[t] + e[t] |
| Multiple Linear Regression - Ordinary Least Squares | |||||
| Variable | Parameter | S.D. | T-STAT H0: parameter = 0 | 2-tail p-value | 1-tail p-value |
| (Intercept) | +6.023 | 2.149 | +2.8030e+00 | 0.006156 | 0.003078 |
| SK1 | +0.6497 | 0.2152 | +3.0190e+00 | 0.003265 | 0.001633 |
| SK2 | +1.201 | 0.2391 | +5.0250e+00 | 2.392e-06 | 1.196e-06 |
| SK3 | -0.01404 | 0.2044 | -6.8670e-02 | 0.9454 | 0.4727 |
| SK4 | +0.4626 | 0.2886 | +1.6030e+00 | 0.1124 | 0.05619 |
| SK5 | +0.1614 | 0.2425 | +6.6550e-01 | 0.5074 | 0.2537 |
| SK6 | -0.02202 | 0.2629 | -8.3780e-02 | 0.9334 | 0.4667 |
| G | -0.1375 | 0.3141 | -4.3780e-01 | 0.6626 | 0.3313 |
| Multiple Linear Regression - Regression Statistics | |
| Multiple R | 0.6155 |
| R-squared | 0.3788 |
| Adjusted R-squared | 0.3326 |
| F-TEST (value) | 8.19 |
| F-TEST (DF numerator) | 7 |
| F-TEST (DF denominator) | 94 |
| p-value | 9.169e-08 |
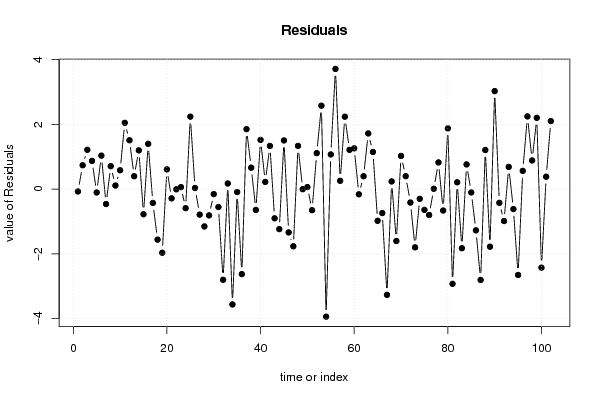
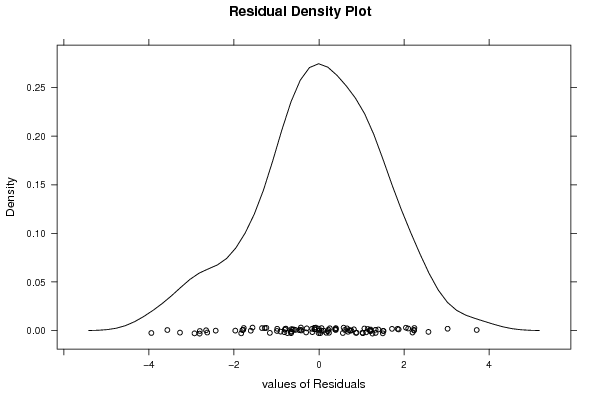
| Multiple Linear Regression - Residual Statistics | |
| Residual Standard Deviation | 1.532 |
| Sum Squared Residuals | 220.7 |
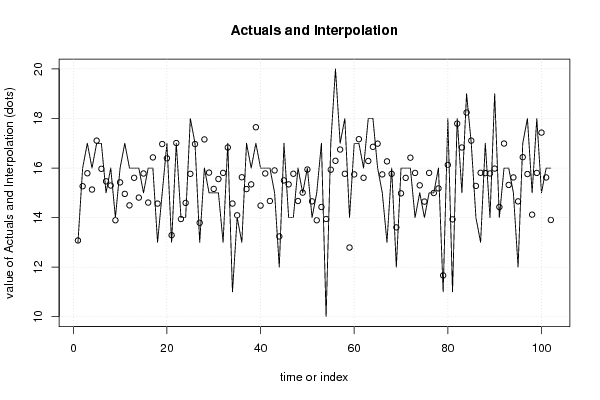
| Multiple Linear Regression - Actuals, Interpolation, and Residuals | |||
| Time or Index | Actuals | Interpolation Forecast | Residuals Prediction Error |
| 1 | 13 | 13.08 | -0.07539 |
| 2 | 16 | 15.27 | 0.7343 |
| 3 | 17 | 15.79 | 1.211 |
| 4 | 16 | 15.13 | 0.8684 |
| 5 | 17 | 17.11 | -0.1062 |
| 6 | 17 | 15.97 | 1.031 |
| 7 | 15 | 15.46 | -0.4642 |
| 8 | 16 | 15.29 | 0.7052 |
| 9 | 14 | 13.89 | 0.1078 |
| 10 | 16 | 15.42 | 0.5794 |
| 11 | 17 | 14.96 | 2.044 |
| 12 | 16 | 14.49 | 1.506 |
| 13 | 16 | 15.61 | 0.3941 |
| 14 | 16 | 14.81 | 1.193 |
| 15 | 15 | 15.78 | -0.7794 |
| 16 | 16 | 14.61 | 1.395 |
| 17 | 16 | 16.43 | -0.4291 |
| 18 | 13 | 14.56 | -1.564 |
| 19 | 15 | 16.97 | -1.969 |
| 20 | 17 | 16.39 | 0.6069 |
| 21 | 13 | 13.29 | -0.2884 |
| 22 | 17 | 17.01 | -0.008941 |
| 23 | 14 | 13.94 | 0.05811 |
| 24 | 14 | 14.59 | -0.592 |
| 25 | 18 | 15.77 | 2.235 |
| 26 | 17 | 16.97 | 0.03128 |
| 27 | 13 | 13.79 | -0.7908 |
| 28 | 16 | 17.16 | -1.156 |
| 29 | 15 | 15.82 | -0.8151 |
| 30 | 15 | 15.16 | -0.1574 |
| 31 | 15 | 15.56 | -0.5557 |
| 32 | 13 | 15.8 | -2.803 |
| 33 | 17 | 16.83 | 0.1707 |
| 34 | 11 | 14.57 | -3.566 |
| 35 | 14 | 14.09 | -0.09341 |
| 36 | 13 | 15.63 | -2.628 |
| 37 | 17 | 15.15 | 1.848 |
| 38 | 16 | 15.34 | 0.6592 |
| 39 | 17 | 17.65 | -0.6465 |
| 40 | 16 | 14.48 | 1.518 |
| 41 | 16 | 15.78 | 0.2187 |
| 42 | 16 | 14.67 | 1.331 |
| 43 | 15 | 15.9 | -0.9048 |
| 44 | 12 | 13.24 | -1.239 |
| 45 | 17 | 15.5 | 1.5 |
| 46 | 14 | 15.34 | -1.341 |
| 47 | 14 | 15.77 | -1.769 |
| 48 | 16 | 14.67 | 1.331 |
| 49 | 15 | 15.01 | -0.006267 |
| 50 | 16 | 15.94 | 0.05918 |
| 51 | 14 | 14.65 | -0.655 |
| 52 | 15 | 13.89 | 1.108 |
| 53 | 17 | 14.43 | 2.574 |
| 54 | 10 | 13.94 | -3.942 |
| 55 | 17 | 15.93 | 1.067 |
| 56 | 20 | 16.29 | 3.708 |
| 57 | 17 | 16.75 | 0.2538 |
| 58 | 18 | 15.77 | 2.233 |
| 59 | 14 | 12.79 | 1.209 |
| 60 | 17 | 15.74 | 1.257 |
| 61 | 17 | 17.16 | -0.1643 |
| 62 | 16 | 15.61 | 0.3941 |
| 63 | 18 | 16.28 | 1.716 |
| 64 | 18 | 16.86 | 1.144 |
| 65 | 16 | 16.98 | -0.9828 |
| 66 | 15 | 15.74 | -0.7434 |
| 67 | 13 | 16.27 | -3.27 |
| 68 | 16 | 15.77 | 0.2346 |
| 69 | 12 | 13.61 | -1.605 |
| 70 | 16 | 14.98 | 1.022 |
| 71 | 16 | 15.6 | 0.396 |
| 72 | 16 | 16.42 | -0.417 |
| 73 | 14 | 15.8 | -1.801 |
| 74 | 15 | 15.3 | -0.3028 |
| 75 | 14 | 14.65 | -0.6451 |
| 76 | 15 | 15.8 | -0.8033 |
| 77 | 15 | 14.99 | 0.007773 |
| 78 | 16 | 15.18 | 0.8206 |
| 79 | 11 | 11.66 | -0.6642 |
| 80 | 18 | 16.13 | 1.872 |
| 81 | 11 | 13.93 | -2.928 |
| 82 | 18 | 17.79 | 0.208 |
| 83 | 15 | 16.83 | -1.829 |
| 84 | 19 | 18.24 | 0.7595 |
| 85 | 17 | 17.11 | -0.1062 |
| 86 | 14 | 15.28 | -1.277 |
| 87 | 13 | 15.81 | -2.808 |
| 88 | 17 | 15.8 | 1.205 |
| 89 | 14 | 15.78 | -1.781 |
| 90 | 19 | 15.98 | 3.024 |
| 91 | 14 | 14.43 | -0.4265 |
| 92 | 16 | 16.99 | -0.9888 |
| 93 | 16 | 15.32 | 0.6831 |
| 94 | 15 | 15.62 | -0.6199 |
| 95 | 12 | 14.65 | -2.655 |
| 96 | 17 | 16.44 | 0.561 |
| 97 | 18 | 15.76 | 2.243 |
| 98 | 15 | 14.12 | 0.8827 |
| 99 | 18 | 15.8 | 2.199 |
| 100 | 15 | 17.43 | -2.429 |
| 101 | 16 | 15.62 | 0.3801 |
| 102 | 16 | 13.9 | 2.098 |
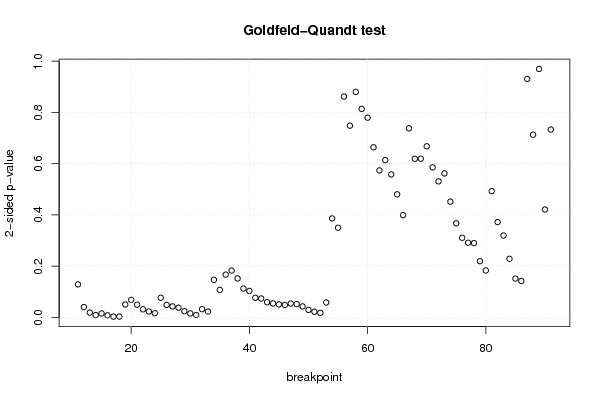
| Goldfeld-Quandt test for Heteroskedasticity | |||
| p-values | Alternative Hypothesis | ||
| breakpoint index | greater | 2-sided | less |
| 11 | 0.06445 | 0.1289 | 0.9355 |
| 12 | 0.02019 | 0.04038 | 0.9798 |
| 13 | 0.009389 | 0.01878 | 0.9906 |
| 14 | 0.004536 | 0.009073 | 0.9955 |
| 15 | 0.007748 | 0.0155 | 0.9923 |
| 16 | 0.004115 | 0.008231 | 0.9959 |
| 17 | 0.001465 | 0.00293 | 0.9985 |
| 18 | 0.001613 | 0.003226 | 0.9984 |
| 19 | 0.02516 | 0.05033 | 0.9748 |
| 20 | 0.03425 | 0.0685 | 0.9658 |
| 21 | 0.02479 | 0.04959 | 0.9752 |
| 22 | 0.01585 | 0.0317 | 0.9841 |
| 23 | 0.01155 | 0.0231 | 0.9885 |
| 24 | 0.008174 | 0.01635 | 0.9918 |
| 25 | 0.03833 | 0.07666 | 0.9617 |
| 26 | 0.02447 | 0.04894 | 0.9755 |
| 27 | 0.02147 | 0.04293 | 0.9785 |
| 28 | 0.01894 | 0.03788 | 0.9811 |
| 29 | 0.01207 | 0.02414 | 0.9879 |
| 30 | 0.007696 | 0.01539 | 0.9923 |
| 31 | 0.00474 | 0.00948 | 0.9953 |
| 32 | 0.01601 | 0.03202 | 0.984 |
| 33 | 0.01147 | 0.02294 | 0.9885 |
| 34 | 0.07345 | 0.1469 | 0.9265 |
| 35 | 0.05384 | 0.1077 | 0.9462 |
| 36 | 0.08348 | 0.167 | 0.9165 |
| 37 | 0.09137 | 0.1827 | 0.9086 |
| 38 | 0.07602 | 0.152 | 0.924 |
| 39 | 0.05637 | 0.1127 | 0.9436 |
| 40 | 0.05169 | 0.1034 | 0.9483 |
| 41 | 0.03824 | 0.07649 | 0.9618 |
| 42 | 0.03692 | 0.07385 | 0.9631 |
| 43 | 0.02961 | 0.05923 | 0.9704 |
| 44 | 0.02724 | 0.05448 | 0.9728 |
| 45 | 0.02545 | 0.0509 | 0.9746 |
| 46 | 0.02437 | 0.04875 | 0.9756 |
| 47 | 0.02709 | 0.05418 | 0.9729 |
| 48 | 0.02597 | 0.05194 | 0.974 |
| 49 | 0.02146 | 0.04292 | 0.9785 |
| 50 | 0.01462 | 0.02923 | 0.9854 |
| 51 | 0.01105 | 0.02211 | 0.9889 |
| 52 | 0.008848 | 0.0177 | 0.9912 |
| 53 | 0.02908 | 0.05816 | 0.9709 |
| 54 | 0.1932 | 0.3864 | 0.8068 |
| 55 | 0.175 | 0.3501 | 0.825 |
| 56 | 0.4311 | 0.8621 | 0.5689 |
| 57 | 0.3742 | 0.7485 | 0.6258 |
| 58 | 0.4402 | 0.8804 | 0.5598 |
| 59 | 0.407 | 0.814 | 0.593 |
| 60 | 0.3898 | 0.7797 | 0.6102 |
| 61 | 0.332 | 0.6641 | 0.668 |
| 62 | 0.2869 | 0.5739 | 0.7131 |
| 63 | 0.307 | 0.6141 | 0.693 |
| 64 | 0.2791 | 0.5582 | 0.7209 |
| 65 | 0.2403 | 0.4806 | 0.7597 |
| 66 | 0.1997 | 0.3993 | 0.8003 |
| 67 | 0.369 | 0.738 | 0.631 |
| 68 | 0.3096 | 0.6191 | 0.6904 |
| 69 | 0.3098 | 0.6195 | 0.6902 |
| 70 | 0.334 | 0.6679 | 0.666 |
| 71 | 0.2928 | 0.5857 | 0.7072 |
| 72 | 0.2656 | 0.5312 | 0.7344 |
| 73 | 0.281 | 0.562 | 0.719 |
| 74 | 0.2259 | 0.4518 | 0.7741 |
| 75 | 0.1836 | 0.3671 | 0.8164 |
| 76 | 0.1554 | 0.3109 | 0.8446 |
| 77 | 0.1458 | 0.2915 | 0.8542 |
| 78 | 0.1451 | 0.2902 | 0.8549 |
| 79 | 0.1097 | 0.2194 | 0.8903 |
| 80 | 0.09164 | 0.1833 | 0.9084 |
| 81 | 0.2464 | 0.4928 | 0.7536 |
| 82 | 0.186 | 0.3721 | 0.814 |
| 83 | 0.1598 | 0.3196 | 0.8402 |
| 84 | 0.1144 | 0.2288 | 0.8856 |
| 85 | 0.07585 | 0.1517 | 0.9242 |
| 86 | 0.07106 | 0.1421 | 0.9289 |
| 87 | 0.4654 | 0.9309 | 0.5346 |
| 88 | 0.3566 | 0.7132 | 0.6434 |
| 89 | 0.485 | 0.9699 | 0.515 |
| 90 | 0.7895 | 0.4211 | 0.2105 |
| 91 | 0.6334 | 0.7332 | 0.3666 |
| Meta Analysis of Goldfeld-Quandt test for Heteroskedasticity | |||
| Description | # significant tests | % significant tests | OK/NOK |
| 1% type I error level | 5 | 0.06173 | NOK |
| 5% type I error level | 24 | 0.296296 | NOK |
| 10% type I error level | 35 | 0.432099 | NOK |
| Ramsey RESET F-Test for powers (2 and 3) of fitted values |
> reset_test_fitted RESET test data: mylm RESET = 0.74779, df1 = 2, df2 = 92, p-value = 0.4763 |
| Ramsey RESET F-Test for powers (2 and 3) of regressors |
> reset_test_regressors RESET test data: mylm RESET = 0.97753, df1 = 14, df2 = 80, p-value = 0.4835 |
| Ramsey RESET F-Test for powers (2 and 3) of principal components |
> reset_test_principal_components RESET test data: mylm RESET = 1.1855, df1 = 2, df2 = 92, p-value = 0.3102 |
| Variance Inflation Factors (Multicollinearity) |
> vif
     SK1      SK2      SK3      SK4      SK5      SK6        G
1.076742 1.173460 1.060510 1.076882 1.041520 1.074715 1.067413
|