| Tabulation of Results | ||||
| KVDD3 x TVDC3 | ||||
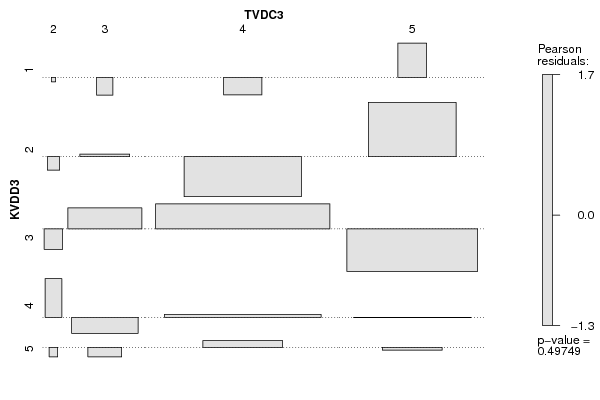
| 2 | 3 | 4 | 5 | 1 | 0 | 0 | 1 | 2 | 2 | 0 | 3 | 11 | 14 | 3 | 0 | 8 | 40 | 14 | 4 | 1 | 4 | 29 | 16 | 5 | 0 | 1 | 8 | 4 |
| Tabulation of Expected Results | ||||
| KVDD3 x TVDC3 | ||||
| 2 | 3 | 4 | 5 | 1 | 0.02 | 0.31 | 1.71 | 0.96 | 2 | 0.18 | 2.87 | 15.97 | 8.97 | 3 | 0.4 | 6.36 | 35.37 | 19.87 | 4 | 0.32 | 5.13 | 28.53 | 16.03 | 5 | 0.08 | 1.33 | 7.42 | 4.17 |
| Statistical Results | |
| Pearson's Chi-squared test | |
| Pearson Chi Square Statistic | 11.37 |
| Degrees of Freedom | 12 |
| P value | 0.5 |