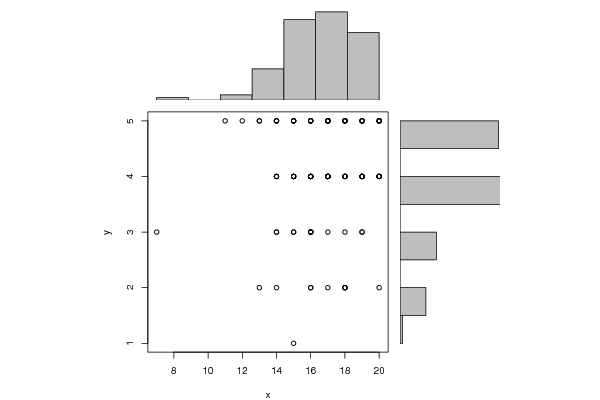
| Pearson Product Moment Correlation - Ungrouped Data | ||
| Statistic | Variable X | Variable Y |
| Mean | 16.7830188679245 | 4.00943396226415 |
| Biased Variance | 5.0189569241723 | 0.952741189035244 |
| Biased Standard Deviation | 2.24030286438515 | 0.976084621861877 |
| Covariance | 0.163971248876909 | |
| Correlation | 0.0742774410868023 | |
| Determination | 0.00551713825440338 | |
| T-Test | 0.759582501981211 | |
| p-value (2 sided) | 0.449222526317455 | |
| p-value (1 sided) | 0.224611263158727 | |
| 95% CI of Correlation | [-0.118152046463793, 0.261330112758602] | |
| Degrees of Freedom | 104 | |
| Number of Observations | 106 | |
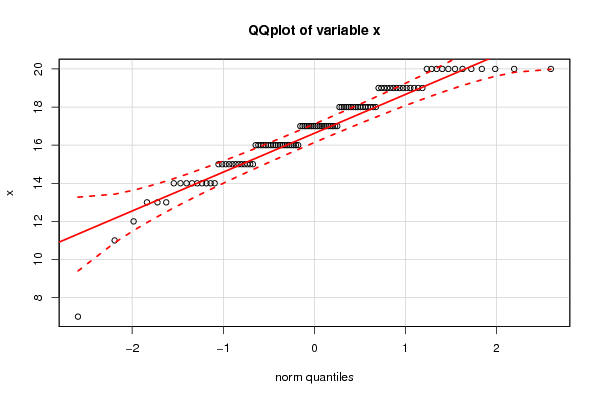
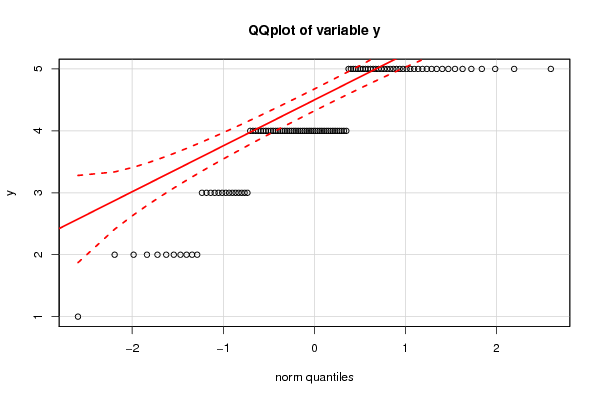
| Normality Tests |
> jarque.x Jarque-Bera Normality Test data: x JB = 35.178, p-value = 2.297e-08 alternative hypothesis: greater |
> jarque.y Jarque-Bera Normality Test data: y JB = 13.429, p-value = 0.001213 alternative hypothesis: greater |
> ad.x Anderson-Darling normality test data: x A = 1.4141, p-value = 0.001114 |
> ad.y Anderson-Darling normality test data: y A = 7.0769, p-value < 2.2e-16 |