| Pearson Product Moment Correlation - Ungrouped Data | ||
| Statistic | Variable X | Variable Y |
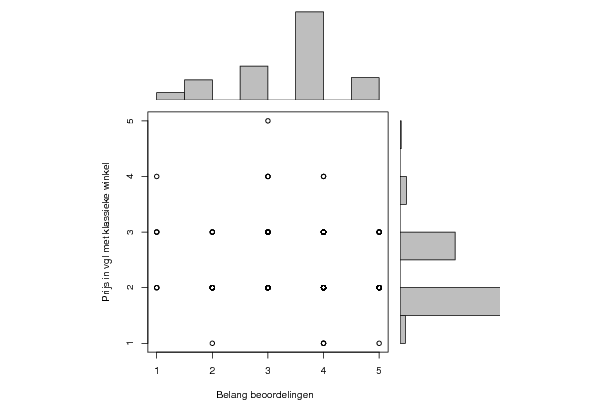
| Mean | 3.5679012345679 | 2.38271604938272 |
| Biased Variance | 0.998475842097241 | 0.409083981100442 |
| Biased Standard Deviation | 0.999237630444952 | 0.639596733184623 |
| Covariance | -0.0509930220075148 | |
| Correlation | -0.0792951443737874 | |
| Determination | 0.00628771992125979 | |
| T-Test | -1.006181335837 | |
| p-value (2 sided) | 0.315847594983877 | |
| p-value (1 sided) | 0.157923797491939 | |
| 95% CI of Correlation | [-0.230670207676837, 0.0758274507793273] | |
| Degrees of Freedom | 160 | |
| Number of Observations | 162 | |
| Normality Tests |
> jarque.x Jarque-Bera Normality Test data: x JB = 17.487, p-value = 0.0001595 alternative hypothesis: greater |
> jarque.y Jarque-Bera Normality Test data: y JB = 31.359, p-value = 1.55e-07 alternative hypothesis: greater |
> ad.x Anderson-Darling normality test data: x A = 11.258, p-value < 2.2e-16 |
> ad.y Anderson-Darling normality test data: y A = 19.817, p-value < 2.2e-16 |