| Multiple Linear Regression - Estimated Regression Equation |
| V5[t] = + 10.2852 -0.230543V1[t] + 0.441032V2[t] + 0.442236V3[t] -0.099862V4[t] -0.00458843t + e[t] |
| Multiple Linear Regression - Ordinary Least Squares | |||||
| Variable | Parameter | S.D. | T-STAT H0: parameter = 0 | 2-tail p-value | 1-tail p-value |
| (Intercept) | +10.29 | 1.223 | +8.4070e+00 | 6.315e-13 | 3.157e-13 |
| V1 | -0.2305 | 0.1353 | -1.7040e+00 | 0.09184 | 0.04592 |
| V2 | +0.441 | 0.1299 | +3.3950e+00 | 0.001028 | 0.000514 |
| V3 | +0.4422 | 0.1519 | +2.9120e+00 | 0.004535 | 0.002267 |
| V4 | -0.09986 | 0.2253 | -4.4320e-01 | 0.6587 | 0.3293 |
| t | -0.004588 | 0.005421 | -8.4640e-01 | 0.3996 | 0.1998 |
| Multiple Linear Regression - Regression Statistics | |
| Multiple R | 0.4427 |
| R-squared | 0.196 |
| Adjusted R-squared | 0.1508 |
| F-TEST (value) | 4.338 |
| F-TEST (DF numerator) | 5 |
| F-TEST (DF denominator) | 89 |
| p-value | 0.001403 |
| Multiple Linear Regression - Residual Statistics | |
| Residual Standard Deviation | 1.414 |
| Sum Squared Residuals | 177.9 |
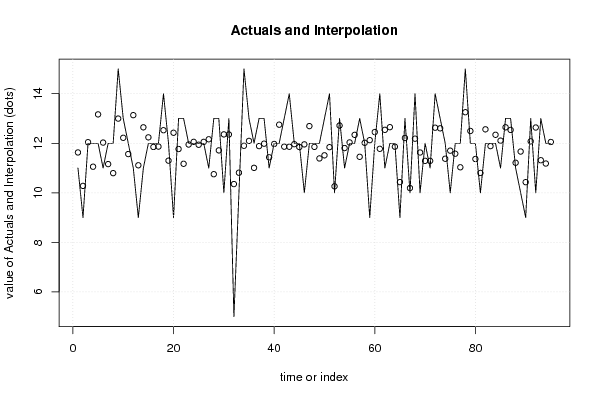
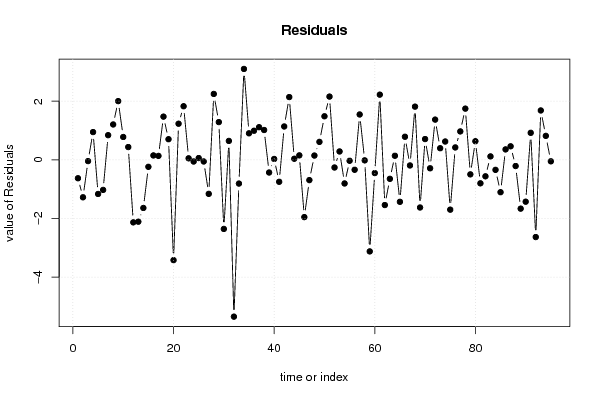
| Multiple Linear Regression - Actuals, Interpolation, and Residuals | |||
| Time or Index | Actuals | Interpolation Forecast | Residuals Prediction Error |
| 1 | 11 | 11.63 | -0.6289 |
| 2 | 9 | 10.28 | -1.279 |
| 3 | 12 | 12.04 | -0.04308 |
| 4 | 12 | 11.05 | 0.947 |
| 5 | 12 | 13.17 | -1.165 |
| 6 | 11 | 12.03 | -1.027 |
| 7 | 12 | 11.16 | 0.8409 |
| 8 | 12 | 10.79 | 1.207 |
| 9 | 15 | 13 | 2.004 |
| 10 | 13 | 12.22 | 0.7798 |
| 11 | 12 | 11.56 | 0.4359 |
| 12 | 11 | 13.13 | -2.134 |
| 13 | 9 | 11.11 | -2.112 |
| 14 | 11 | 12.64 | -1.643 |
| 15 | 12 | 12.24 | -0.2386 |
| 16 | 12 | 11.85 | 0.1497 |
| 17 | 12 | 11.87 | 0.1342 |
| 18 | 14 | 12.53 | 1.474 |
| 19 | 12 | 11.3 | 0.7031 |
| 20 | 9 | 12.42 | -3.424 |
| 21 | 13 | 11.77 | 1.232 |
| 22 | 13 | 11.17 | 1.829 |
| 23 | 12 | 11.95 | 0.0511 |
| 24 | 12 | 12.06 | -0.05735 |
| 25 | 12 | 11.94 | 0.06027 |
| 26 | 12 | 12.06 | -0.05626 |
| 27 | 11 | 12.16 | -1.161 |
| 28 | 13 | 10.75 | 2.249 |
| 29 | 13 | 11.71 | 1.288 |
| 30 | 10 | 12.36 | -2.359 |
| 31 | 13 | 12.35 | 0.6456 |
| 32 | 5 | 10.35 | -5.353 |
| 33 | 10 | 10.81 | -0.8105 |
| 34 | 15 | 11.9 | 3.102 |
| 35 | 13 | 12.09 | 0.9052 |
| 36 | 12 | 11.01 | 0.9928 |
| 37 | 13 | 11.89 | 1.114 |
| 38 | 13 | 11.98 | 1.018 |
| 39 | 11 | 11.43 | -0.4333 |
| 40 | 12 | 11.97 | 0.02924 |
| 41 | 12 | 12.75 | -0.7496 |
| 42 | 13 | 11.86 | 1.138 |
| 43 | 14 | 11.86 | 2.142 |
| 44 | 12 | 11.96 | 0.03683 |
| 45 | 12 | 11.85 | 0.152 |
| 46 | 10 | 11.96 | -1.955 |
| 47 | 12 | 12.69 | -0.6924 |
| 48 | 12 | 11.85 | 0.1458 |
| 49 | 12 | 11.39 | 0.6126 |
| 50 | 13 | 11.51 | 1.487 |
| 51 | 14 | 11.84 | 2.158 |
| 52 | 10 | 10.26 | -0.2622 |
| 53 | 13 | 12.71 | 0.2854 |
| 54 | 11 | 11.81 | -0.8067 |
| 55 | 12 | 12.03 | -0.03262 |
| 56 | 12 | 12.34 | -0.3396 |
| 57 | 13 | 11.45 | 1.547 |
| 58 | 12 | 12.02 | -0.01885 |
| 59 | 9 | 12.13 | -3.126 |
| 60 | 12 | 12.45 | -0.4519 |
| 61 | 14 | 11.78 | 2.224 |
| 62 | 11 | 12.54 | -1.543 |
| 63 | 12 | 12.65 | -0.6486 |
| 64 | 12 | 11.86 | 0.1382 |
| 65 | 9 | 10.43 | -1.433 |
| 66 | 13 | 12.21 | 0.7873 |
| 67 | 10 | 10.19 | -0.1922 |
| 68 | 14 | 12.18 | 1.815 |
| 69 | 10 | 11.63 | -1.627 |
| 70 | 12 | 11.29 | 0.709 |
| 71 | 11 | 11.29 | -0.2888 |
| 72 | 14 | 12.63 | 1.373 |
| 73 | 13 | 12.6 | 0.396 |
| 74 | 12 | 11.37 | 0.6251 |
| 75 | 10 | 11.7 | -1.701 |
| 76 | 12 | 11.58 | 0.4226 |
| 77 | 12 | 11.03 | 0.9692 |
| 78 | 15 | 13.25 | 1.747 |
| 79 | 12 | 12.5 | -0.4966 |
| 80 | 12 | 11.37 | 0.635 |
| 81 | 10 | 10.8 | -0.8019 |
| 82 | 12 | 12.56 | -0.5627 |
| 83 | 12 | 11.88 | 0.1159 |
| 84 | 12 | 12.34 | -0.3418 |
| 85 | 11 | 12.11 | -1.105 |
| 86 | 13 | 12.64 | 0.3558 |
| 87 | 13 | 12.54 | 0.4615 |
| 88 | 11 | 11.21 | -0.212 |
| 89 | 10 | 11.67 | -1.666 |
| 90 | 9 | 10.43 | -1.429 |
| 91 | 13 | 12.08 | 0.9221 |
| 92 | 10 | 12.64 | -2.635 |
| 93 | 13 | 11.31 | 1.685 |
| 94 | 12 | 11.18 | 0.8179 |
| 95 | 12 | 12.05 | -0.05121 |
| Goldfeld-Quandt test for Heteroskedasticity | |||
| p-values | Alternative Hypothesis | ||
| breakpoint index | greater | 2-sided | less |
| 9 | 0.486 | 0.972 | 0.514 |
| 10 | 0.4025 | 0.8049 | 0.5975 |
| 11 | 0.3361 | 0.6723 | 0.6639 |
| 12 | 0.4269 | 0.8539 | 0.5731 |
| 13 | 0.5898 | 0.8204 | 0.4102 |
| 14 | 0.5872 | 0.8256 | 0.4128 |
| 15 | 0.5262 | 0.9475 | 0.4738 |
| 16 | 0.4263 | 0.8525 | 0.5737 |
| 17 | 0.3357 | 0.6715 | 0.6643 |
| 18 | 0.4165 | 0.8329 | 0.5835 |
| 19 | 0.3337 | 0.6674 | 0.6663 |
| 20 | 0.4584 | 0.9168 | 0.5416 |
| 21 | 0.6098 | 0.7804 | 0.3902 |
| 22 | 0.5847 | 0.8307 | 0.4153 |
| 23 | 0.5104 | 0.9791 | 0.4895 |
| 24 | 0.4398 | 0.8796 | 0.5602 |
| 25 | 0.3692 | 0.7384 | 0.6308 |
| 26 | 0.3082 | 0.6163 | 0.6918 |
| 27 | 0.2678 | 0.5357 | 0.7322 |
| 28 | 0.4264 | 0.8528 | 0.5736 |
| 29 | 0.3754 | 0.7508 | 0.6246 |
| 30 | 0.5125 | 0.9751 | 0.4875 |
| 31 | 0.4583 | 0.9167 | 0.5417 |
| 32 | 0.9881 | 0.0239 | 0.01195 |
| 33 | 0.9854 | 0.02917 | 0.01458 |
| 34 | 0.997 | 0.005989 | 0.002994 |
| 35 | 0.9956 | 0.008817 | 0.004409 |
| 36 | 0.9939 | 0.0123 | 0.00615 |
| 37 | 0.9919 | 0.01623 | 0.008113 |
| 38 | 0.989 | 0.022 | 0.011 |
| 39 | 0.9845 | 0.03091 | 0.01545 |
| 40 | 0.9774 | 0.04528 | 0.02264 |
| 41 | 0.9713 | 0.05736 | 0.02868 |
| 42 | 0.9654 | 0.06911 | 0.03456 |
| 43 | 0.9744 | 0.05123 | 0.02562 |
| 44 | 0.9635 | 0.07299 | 0.0365 |
| 45 | 0.9491 | 0.1018 | 0.05091 |
| 46 | 0.9665 | 0.06699 | 0.0335 |
| 47 | 0.96 | 0.08001 | 0.04 |
| 48 | 0.9445 | 0.1111 | 0.05555 |
| 49 | 0.9264 | 0.1473 | 0.07365 |
| 50 | 0.9218 | 0.1564 | 0.07821 |
| 51 | 0.9486 | 0.1027 | 0.05135 |
| 52 | 0.9334 | 0.1332 | 0.06659 |
| 53 | 0.9134 | 0.1733 | 0.08663 |
| 54 | 0.8996 | 0.2008 | 0.1004 |
| 55 | 0.8688 | 0.2624 | 0.1312 |
| 56 | 0.8381 | 0.3237 | 0.1619 |
| 57 | 0.8491 | 0.3018 | 0.1509 |
| 58 | 0.8084 | 0.3832 | 0.1916 |
| 59 | 0.9596 | 0.08076 | 0.04038 |
| 60 | 0.9484 | 0.1033 | 0.05163 |
| 61 | 0.9677 | 0.06467 | 0.03234 |
| 62 | 0.9741 | 0.05184 | 0.02592 |
| 63 | 0.9772 | 0.04556 | 0.02278 |
| 64 | 0.9658 | 0.06837 | 0.03419 |
| 65 | 0.9671 | 0.06577 | 0.03288 |
| 66 | 0.954 | 0.092 | 0.046 |
| 67 | 0.9367 | 0.1265 | 0.06325 |
| 68 | 0.9351 | 0.1298 | 0.06489 |
| 69 | 0.9521 | 0.09585 | 0.04793 |
| 70 | 0.931 | 0.1379 | 0.06897 |
| 71 | 0.9066 | 0.1867 | 0.09336 |
| 72 | 0.9007 | 0.1986 | 0.09931 |
| 73 | 0.8594 | 0.2813 | 0.1406 |
| 74 | 0.821 | 0.358 | 0.179 |
| 75 | 0.8396 | 0.3209 | 0.1604 |
| 76 | 0.7787 | 0.4426 | 0.2213 |
| 77 | 0.73 | 0.5399 | 0.27 |
| 78 | 0.7964 | 0.4071 | 0.2036 |
| 79 | 0.7801 | 0.4398 | 0.2199 |
| 80 | 0.7714 | 0.4572 | 0.2286 |
| 81 | 0.7307 | 0.5386 | 0.2693 |
| 82 | 0.6276 | 0.7447 | 0.3724 |
| 83 | 0.5073 | 0.9854 | 0.4927 |
| 84 | 0.4317 | 0.8635 | 0.5683 |
| 85 | 0.3746 | 0.7493 | 0.6254 |
| 86 | 0.238 | 0.476 | 0.762 |
| Meta Analysis of Goldfeld-Quandt test for Heteroskedasticity | |||
| Description | # significant tests | % significant tests | OK/NOK |
| 1% type I error level | 2 | 0.02564 | NOK |
| 5% type I error level | 10 | 0.128205 | NOK |
| 10% type I error level | 23 | 0.294872 | NOK |
| Ramsey RESET F-Test for powers (2 and 3) of fitted values |
> reset_test_fitted RESET test data: mylm RESET = 6.8132, df1 = 2, df2 = 87, p-value = 0.001783 |
| Ramsey RESET F-Test for powers (2 and 3) of regressors |
> reset_test_regressors RESET test data: mylm RESET = 1.055, df1 = 10, df2 = 79, p-value = 0.4067 |
| Ramsey RESET F-Test for powers (2 and 3) of principal components |
> reset_test_principal_components RESET test data: mylm RESET = 0.35495, df1 = 2, df2 = 87, p-value = 0.7022 |
| Variance Inflation Factors (Multicollinearity) |
> vif
      V1       V2       V3       V4        t
1.017552 1.054518 1.081245 1.082508 1.050060
|