| Pearson Product Moment Correlation - Ungrouped Data | ||
| Statistic | Variable X | Variable Y |
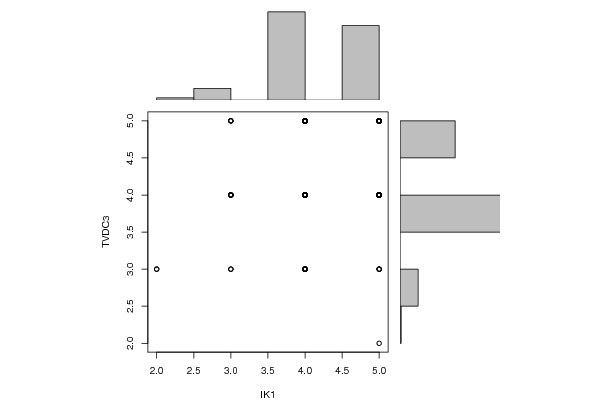
| Mean | 4.33132530120482 | 4.19879518072289 |
| Biased Variance | 0.426368123094789 | 0.400239512265931 |
| Biased Standard Deviation | 0.652968699934988 | 0.632644854769191 |
| Covariance | 0.0670682730923695 | |
| Correlation | 0.161376627812939 | |
| Determination | 0.0260424160042759 | |
| T-Test | 2.09407647640285 | |
| p-value (2 sided) | 0.0377908859272238 | |
| p-value (1 sided) | 0.0188954429636119 | |
| 95% CI of Correlation | [0.00928331793574817, 0.306172076313529] | |
| Degrees of Freedom | 164 | |
| Number of Observations | 166 | |
| Normality Tests |
> jarque.x Jarque-Bera Normality Test data: x JB = 16.929, p-value = 0.0002109 alternative hypothesis: greater |
> jarque.y Jarque-Bera Normality Test data: y JB = 3.0385, p-value = 0.2189 alternative hypothesis: greater |
> ad.x Anderson-Darling normality test data: x A = 17.472, p-value < 2.2e-16 |
> ad.y Anderson-Darling normality test data: y A = 17.606, p-value < 2.2e-16 |