| Multiple Linear Regression - Estimated Regression Equation |
| TevrSUM[t] = + 14.9975 -0.416161Imago1[t] + 0.141125Imago2[t] + 0.15563Imago3[t] + 0.230593Imago4[t] + e[t] |
| Multiple Linear Regression - Ordinary Least Squares | |||||
| Variable | Parameter | S.D. | T-STAT H0: parameter = 0 | 2-tail p-value | 1-tail p-value |
| (Intercept) | +15 | 1.401 | +1.0700e+01 | 5.905e-18 | 2.952e-18 |
| Imago1 | -0.4162 | 0.1796 | -2.3180e+00 | 0.02265 | 0.01132 |
| Imago2 | +0.1411 | 0.1666 | +8.4710e-01 | 0.3991 | 0.1995 |
| Imago3 | +0.1556 | 0.1893 | +8.2200e-01 | 0.4131 | 0.2066 |
| Imago4 | +0.2306 | 0.2475 | +9.3180e-01 | 0.3538 | 0.1769 |
| Multiple Linear Regression - Regression Statistics | |
| Multiple R | 0.258 |
| R-squared | 0.06656 |
| Adjusted R-squared | 0.02684 |
| F-TEST (value) | 1.676 |
| F-TEST (DF numerator) | 4 |
| F-TEST (DF denominator) | 94 |
| p-value | 0.1621 |
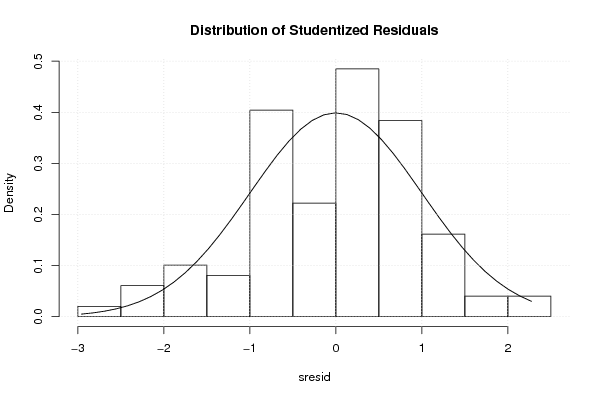
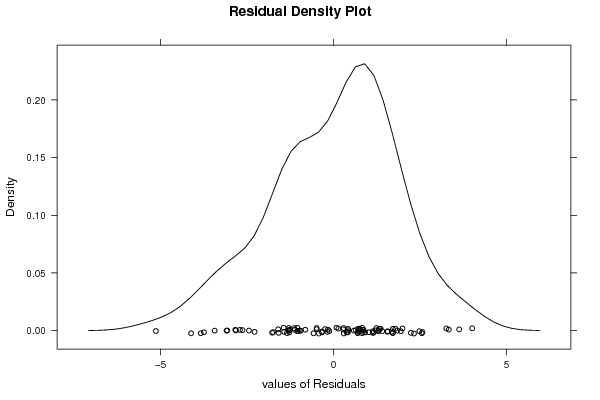
| Multiple Linear Regression - Residual Statistics | |
| Residual Standard Deviation | 1.843 |
| Sum Squared Residuals | 319.3 |
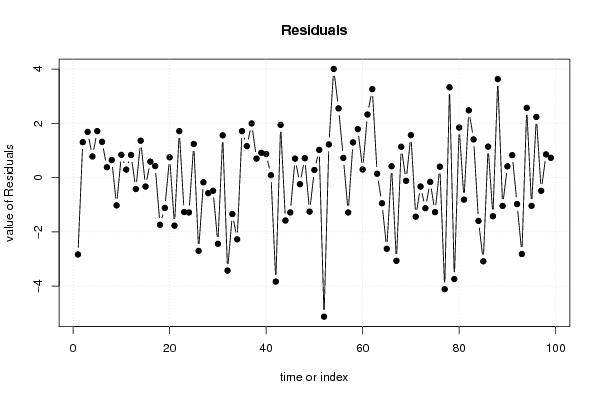
| Multiple Linear Regression - Actuals, Interpolation, and Residuals | |||
| Time or Index | Actuals | Interpolation Forecast | Residuals Prediction Error |
| 1 | 13 | 15.84 | -2.837 |
| 2 | 16 | 14.69 | 1.307 |
| 3 | 17 | 15.32 | 1.684 |
| 4 | 16 | 15.22 | 0.7795 |
| 5 | 17 | 15.29 | 1.713 |
| 6 | 17 | 15.68 | 1.319 |
| 7 | 15 | 14.62 | 0.3818 |
| 8 | 16 | 15.35 | 0.6472 |
| 9 | 14 | 15.03 | -1.026 |
| 10 | 16 | 15.16 | 0.84 |
| 11 | 17 | 16.71 | 0.2947 |
| 12 | 16 | 15.17 | 0.8327 |
| 13 | 16 | 16.42 | -0.423 |
| 14 | 16 | 14.64 | 1.36 |
| 15 | 15 | 15.33 | -0.3311 |
| 16 | 16 | 15.41 | 0.5876 |
| 17 | 16 | 15.58 | 0.4238 |
| 18 | 13 | 14.74 | -1.744 |
| 19 | 15 | 16.12 | -1.119 |
| 20 | 17 | 16.25 | 0.7471 |
| 21 | 13 | 14.77 | -1.774 |
| 22 | 17 | 15.29 | 1.713 |
| 23 | 14 | 15.27 | -1.271 |
| 24 | 14 | 15.29 | -1.287 |
| 25 | 17 | 15.76 | 1.238 |
| 26 | 13 | 15.7 | -2.703 |
| 27 | 16 | 16.17 | -0.1722 |
| 28 | 15 | 15.58 | -0.5762 |
| 29 | 15 | 15.49 | -0.4867 |
| 30 | 13 | 15.44 | -2.442 |
| 31 | 17 | 15.44 | 1.558 |
| 32 | 11 | 14.43 | -3.433 |
| 33 | 14 | 15.35 | -1.346 |
| 34 | 13 | 15.28 | -2.279 |
| 35 | 17 | 15.29 | 1.713 |
| 36 | 16 | 14.84 | 1.16 |
| 37 | 17 | 15 | 1.996 |
| 38 | 16 | 15.3 | 0.6988 |
| 39 | 16 | 15.09 | 0.9149 |
| 40 | 16 | 15.13 | 0.869 |
| 41 | 15 | 14.91 | 0.08505 |
| 42 | 12 | 15.84 | -3.837 |
| 43 | 17 | 15.06 | 1.944 |
| 44 | 14 | 15.58 | -1.583 |
| 45 | 14 | 15.29 | -1.287 |
| 46 | 16 | 15.3 | 0.6988 |
| 47 | 15 | 15.24 | -0.2422 |
| 48 | 16 | 15.29 | 0.7133 |
| 49 | 14 | 15.26 | -1.257 |
| 50 | 15 | 14.72 | 0.2794 |
| 51 | 17 | 15.98 | 1.022 |
| 52 | 10 | 15.13 | -5.131 |
| 53 | 17 | 15.78 | 1.222 |
| 54 | 20 | 15.99 | 4.008 |
| 55 | 17 | 14.45 | 2.553 |
| 56 | 17 | 16.27 | 0.7254 |
| 57 | 14 | 15.29 | -1.287 |
| 58 | 17 | 15.7 | 1.297 |
| 59 | 17 | 15.21 | 1.788 |
| 60 | 16 | 15.7 | 0.2972 |
| 61 | 18 | 15.67 | 2.327 |
| 62 | 18 | 14.74 | 3.262 |
| 63 | 16 | 15.86 | 0.1415 |
| 64 | 15 | 15.95 | -0.9479 |
| 65 | 13 | 15.63 | -2.628 |
| 66 | 16 | 15.58 | 0.4166 |
| 67 | 12 | 15.07 | -3.071 |
| 68 | 16 | 14.86 | 1.137 |
| 69 | 16 | 16.12 | -0.119 |
| 70 | 16 | 14.43 | 1.567 |
| 71 | 14 | 15.44 | -1.442 |
| 72 | 15 | 15.33 | -0.3311 |
| 73 | 14 | 15.13 | -1.131 |
| 74 | 15 | 15.16 | -0.16 |
| 75 | 15 | 16.27 | -1.275 |
| 76 | 16 | 15.6 | 0.4021 |
| 77 | 11 | 15.12 | -4.115 |
| 78 | 18 | 14.67 | 3.331 |
| 79 | 11 | 14.74 | -3.744 |
| 80 | 18 | 16.16 | 1.845 |
| 81 | 15 | 15.81 | -0.8134 |
| 82 | 19 | 16.52 | 2.48 |
| 83 | 17 | 15.59 | 1.408 |
| 84 | 14 | 15.6 | -1.598 |
| 85 | 13 | 16.09 | -3.089 |
| 86 | 17 | 15.86 | 1.142 |
| 87 | 14 | 15.43 | -1.428 |
| 88 | 19 | 15.37 | 3.633 |
| 89 | 14 | 15.05 | -1.047 |
| 90 | 16 | 15.58 | 0.4166 |
| 91 | 16 | 15.17 | 0.8254 |
| 92 | 15 | 15.98 | -0.9779 |
| 93 | 12 | 14.82 | -2.819 |
| 94 | 18 | 15.43 | 2.572 |
| 95 | 15 | 16.04 | -1.044 |
| 96 | 18 | 15.76 | 2.237 |
| 97 | 15 | 15.49 | -0.4867 |
| 98 | 16 | 15.15 | 0.8545 |
| 99 | 16 | 15.27 | 0.7293 |
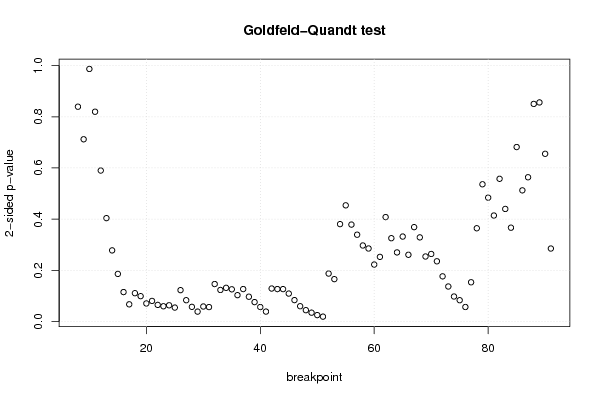
| Goldfeld-Quandt test for Heteroskedasticity | |||
| p-values | Alternative Hypothesis | ||
| breakpoint index | greater | 2-sided | less |
| 8 | 0.5804 | 0.8393 | 0.4196 |
| 9 | 0.6439 | 0.7121 | 0.3561 |
| 10 | 0.5066 | 0.9867 | 0.4934 |
| 11 | 0.4098 | 0.8197 | 0.5902 |
| 12 | 0.295 | 0.5901 | 0.705 |
| 13 | 0.2021 | 0.4042 | 0.7979 |
| 14 | 0.1391 | 0.2782 | 0.8609 |
| 15 | 0.09315 | 0.1863 | 0.9068 |
| 16 | 0.05773 | 0.1155 | 0.9423 |
| 17 | 0.03383 | 0.06765 | 0.9662 |
| 18 | 0.05557 | 0.1111 | 0.9444 |
| 19 | 0.04977 | 0.09954 | 0.9502 |
| 20 | 0.03554 | 0.07107 | 0.9645 |
| 21 | 0.04043 | 0.08085 | 0.9596 |
| 22 | 0.03267 | 0.06534 | 0.9673 |
| 23 | 0.03002 | 0.06004 | 0.97 |
| 24 | 0.03194 | 0.06389 | 0.9681 |
| 25 | 0.02746 | 0.05492 | 0.9725 |
| 26 | 0.0615 | 0.123 | 0.9385 |
| 27 | 0.04183 | 0.08367 | 0.9582 |
| 28 | 0.02885 | 0.0577 | 0.9711 |
| 29 | 0.01954 | 0.03907 | 0.9805 |
| 30 | 0.02955 | 0.05909 | 0.9705 |
| 31 | 0.02846 | 0.05692 | 0.9715 |
| 32 | 0.07344 | 0.1469 | 0.9266 |
| 33 | 0.06185 | 0.1237 | 0.9382 |
| 34 | 0.06601 | 0.132 | 0.934 |
| 35 | 0.06315 | 0.1263 | 0.9369 |
| 36 | 0.05172 | 0.1034 | 0.9483 |
| 37 | 0.06362 | 0.1272 | 0.9364 |
| 38 | 0.04862 | 0.09723 | 0.9514 |
| 39 | 0.03815 | 0.07629 | 0.9619 |
| 40 | 0.02852 | 0.05705 | 0.9715 |
| 41 | 0.01963 | 0.03926 | 0.9804 |
| 42 | 0.06465 | 0.1293 | 0.9354 |
| 43 | 0.06354 | 0.1271 | 0.9365 |
| 44 | 0.06355 | 0.1271 | 0.9365 |
| 45 | 0.05479 | 0.1096 | 0.9452 |
| 46 | 0.04204 | 0.08408 | 0.958 |
| 47 | 0.03011 | 0.06021 | 0.9699 |
| 48 | 0.02235 | 0.04471 | 0.9776 |
| 49 | 0.01748 | 0.03496 | 0.9825 |
| 50 | 0.01278 | 0.02555 | 0.9872 |
| 51 | 0.009733 | 0.01947 | 0.9903 |
| 52 | 0.09388 | 0.1878 | 0.9061 |
| 53 | 0.08297 | 0.1659 | 0.917 |
| 54 | 0.1904 | 0.3809 | 0.8096 |
| 55 | 0.2271 | 0.4542 | 0.7729 |
| 56 | 0.1895 | 0.379 | 0.8105 |
| 57 | 0.1697 | 0.3394 | 0.8303 |
| 58 | 0.1487 | 0.2973 | 0.8513 |
| 59 | 0.1428 | 0.2857 | 0.8572 |
| 60 | 0.1115 | 0.2229 | 0.8885 |
| 61 | 0.1264 | 0.2528 | 0.8736 |
| 62 | 0.2041 | 0.4082 | 0.7959 |
| 63 | 0.1629 | 0.3258 | 0.8371 |
| 64 | 0.1351 | 0.2703 | 0.8649 |
| 65 | 0.1661 | 0.3322 | 0.8339 |
| 66 | 0.1306 | 0.2611 | 0.8694 |
| 67 | 0.1845 | 0.3691 | 0.8155 |
| 68 | 0.1645 | 0.3291 | 0.8355 |
| 69 | 0.1272 | 0.2543 | 0.8728 |
| 70 | 0.1321 | 0.2642 | 0.8679 |
| 71 | 0.1179 | 0.2358 | 0.8821 |
| 72 | 0.08845 | 0.1769 | 0.9115 |
| 73 | 0.0686 | 0.1372 | 0.9314 |
| 74 | 0.04904 | 0.09809 | 0.951 |
| 75 | 0.04186 | 0.08372 | 0.9581 |
| 76 | 0.02858 | 0.05717 | 0.9714 |
| 77 | 0.07687 | 0.1537 | 0.9231 |
| 78 | 0.1823 | 0.3647 | 0.8177 |
| 79 | 0.2682 | 0.5364 | 0.7318 |
| 80 | 0.242 | 0.4841 | 0.758 |
| 81 | 0.2072 | 0.4144 | 0.7928 |
| 82 | 0.2789 | 0.5578 | 0.7211 |
| 83 | 0.22 | 0.44 | 0.78 |
| 84 | 0.1834 | 0.3668 | 0.8166 |
| 85 | 0.3409 | 0.6817 | 0.6591 |
| 86 | 0.2563 | 0.5127 | 0.7437 |
| 87 | 0.2819 | 0.5638 | 0.7181 |
| 88 | 0.4251 | 0.8501 | 0.5749 |
| 89 | 0.428 | 0.856 | 0.572 |
| 90 | 0.3277 | 0.6554 | 0.6723 |
| 91 | 0.8573 | 0.2855 | 0.1427 |
| Meta Analysis of Goldfeld-Quandt test for Heteroskedasticity | |||
| Description | # significant tests | % significant tests | OK/NOK |
| 1% type I error level | 0 | 0 | OK |
| 5% type I error level | 6 | 0.0714286 | NOK |
| 10% type I error level | 26 | 0.309524 | NOK |
| Ramsey RESET F-Test for powers (2 and 3) of fitted values |
> reset_test_fitted RESET test data: mylm RESET = 0.31852, df1 = 2, df2 = 92, p-value = 0.728 |
| Ramsey RESET F-Test for powers (2 and 3) of regressors |
> reset_test_regressors RESET test data: mylm RESET = 1.4997, df1 = 8, df2 = 86, p-value = 0.1692 |
| Ramsey RESET F-Test for powers (2 and 3) of principal components |
> reset_test_principal_components RESET test data: mylm RESET = 0.38035, df1 = 2, df2 = 92, p-value = 0.6847 |
| Variance Inflation Factors (Multicollinearity) |
> vif Imago1 Imago2 Imago3 Imago4 1.032480 1.038649 1.063048 1.055761 |