| Pearson Product Moment Correlation - Ungrouped Data | ||
| Statistic | Variable X | Variable Y |
| Mean | 13.84 | 15.47 |
| Biased Variance | 3.4944 | 3.4891 |
| Biased Standard Deviation | 1.86933143128767 | 1.86791327421805 |
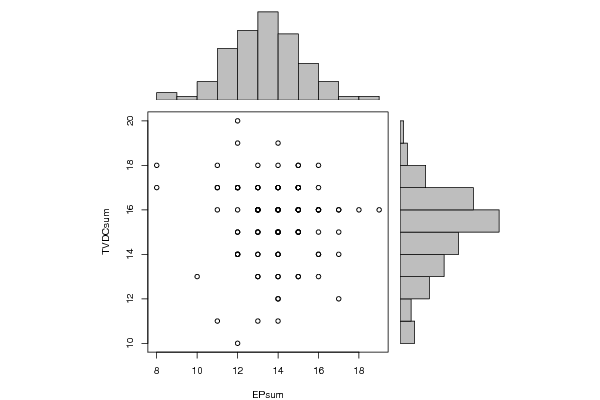
| Covariance | -0.206868686868687 | |
| Correlation | -0.0586525550168581 | |
| Determination | 0.00344012221000556 | |
| T-Test | -0.581631975842094 | |
| p-value (2 sided) | 0.562150108553125 | |
| p-value (1 sided) | 0.281075054276562 | |
| 95% CI of Correlation | [-0.252165617749821, 0.139371177789947] | |
| Degrees of Freedom | 98 | |
| Number of Observations | 100 | |
| Normality Tests |
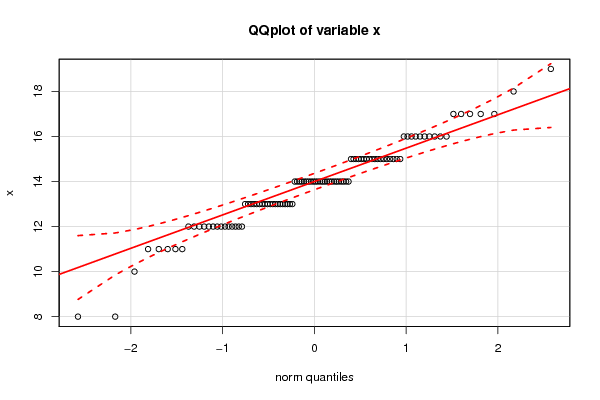
> jarque.x Jarque-Bera Normality Test data: x JB = 4.741, p-value = 0.09343 alternative hypothesis: greater |
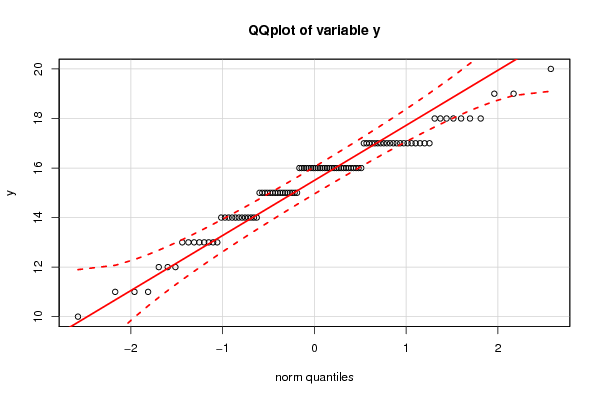
> jarque.y Jarque-Bera Normality Test data: y JB = 5.0995, p-value = 0.0781 alternative hypothesis: greater |
> ad.x Anderson-Darling normality test data: x A = 1.4199, p-value = 0.001074 |
> ad.y Anderson-Darling normality test data: y A = 2.0695, p-value = 2.669e-05 |