| Pearson Product Moment Correlation - Ungrouped Data | ||
| Statistic | Variable X | Variable Y |
| Mean | 1.67484662576687 | 16.4478527607362 |
| Biased Variance | 1.15194399488125 | 6.21047084948624 |
| Biased Standard Deviation | 1.07328653903851 | 2.49208162977986 |
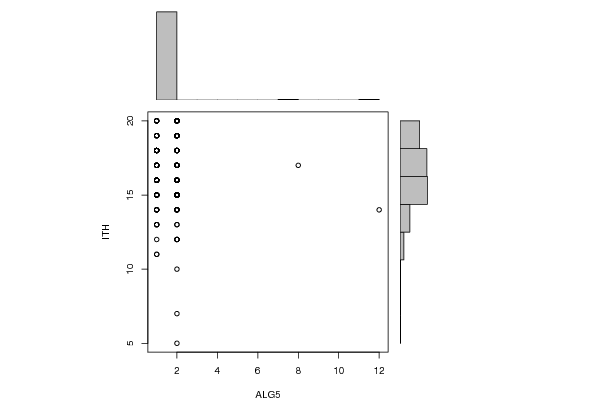
| Covariance | -0.112739528894948 | |
| Correlation | -0.0418914776344211 | |
| Determination | 0.00175489589839521 | |
| T-Test | -0.532010278557453 | |
| p-value (2 sided) | 0.595452241699358 | |
| p-value (1 sided) | 0.297726120849679 | |
| 95% CI of Correlation | [-0.194360370345977, 0.112553813064712] | |
| Degrees of Freedom | 161 | |
| Number of Observations | 163 | |
| Normality Tests |
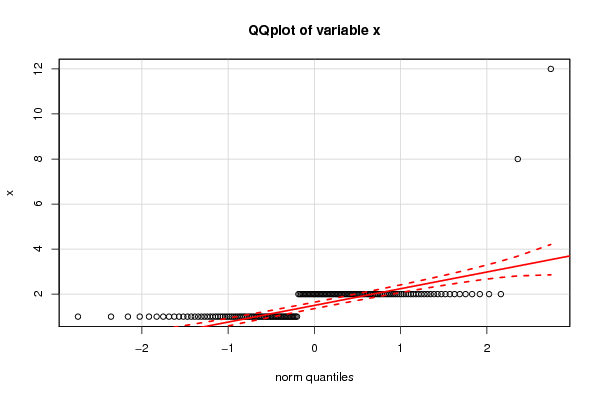
> jarque.x Jarque-Bera Normality Test data: x JB = 23272, p-value < 2.2e-16 alternative hypothesis: greater |
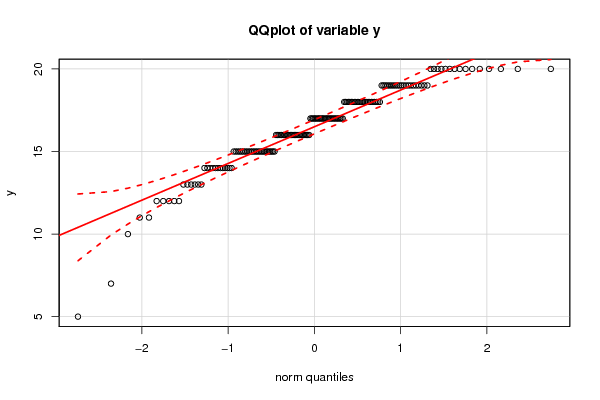
> jarque.y Jarque-Bera Normality Test data: y JB = 79.515, p-value < 2.2e-16 alternative hypothesis: greater |
> ad.x Anderson-Darling normality test data: x A = 24.542, p-value < 2.2e-16 |
> ad.y Anderson-Darling normality test data: y A = 2.3164, p-value = 6.847e-06 |