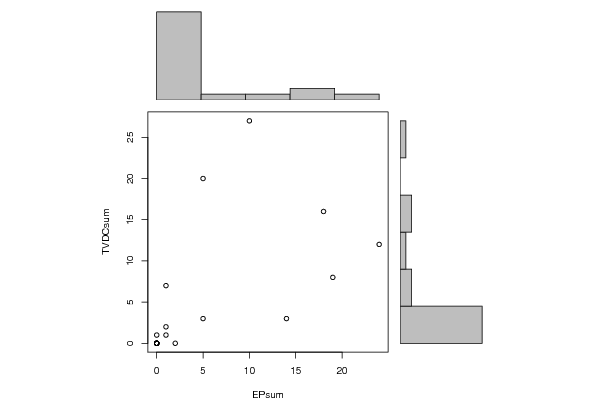
| Pearson Product Moment Correlation - Ungrouped Data | ||
| Statistic | Variable X | Variable Y |
| Mean | 5 | 5 |
| Biased Variance | 55.7 | 58.3 |
| Biased Standard Deviation | 7.46324326281812 | 7.63544366752843 |
| Covariance | 35 | |
| Correlation | 0.583485105893114 | |
| Determination | 0.340454868799098 | |
| T-Test | 3.04820216968964 | |
| p-value (2 sided) | 0.00691952741696539 | |
| p-value (1 sided) | 0.00345976370848269 | |
| 95% CI of Correlation | [0.190031191841013, 0.815452546079237] | |
| Degrees of Freedom | 18 | |
| Number of Observations | 20 | |
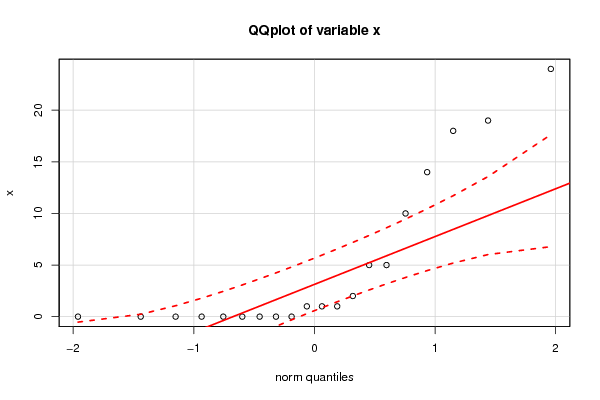
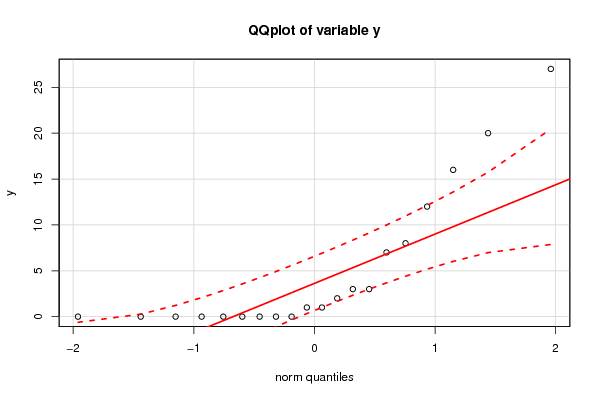
| Normality Tests |
> jarque.x Jarque-Bera Normality Test data: x JB = 6.3017, p-value = 0.04282 alternative hypothesis: greater |
> jarque.y Jarque-Bera Normality Test data: y JB = 10.727, p-value = 0.004684 alternative hypothesis: greater |
> ad.x Anderson-Darling normality test data: x A = 2.5823, p-value = 8.747e-07 |
> ad.y Anderson-Darling normality test data: y A = 2.422, p-value = 2.236e-06 |