| Pearson Product Moment Correlation - Ungrouped Data | ||
| Statistic | Variable X | Variable Y |
| Mean | 4.49019607843137 | 15.4803921568627 |
| Biased Variance | 0.622452902729719 | 3.50451749327182 |
| Biased Standard Deviation | 0.788956844656106 | 1.87203565491468 |
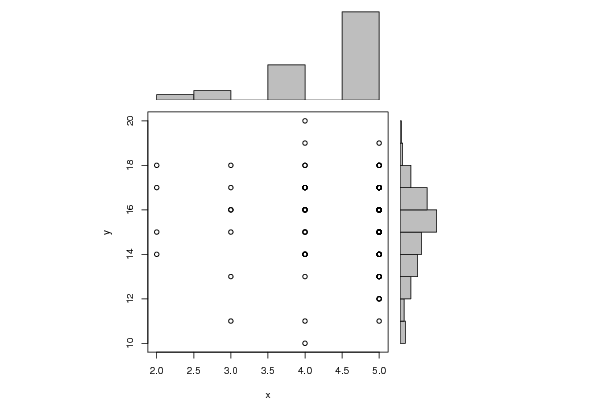
| Covariance | -0.0496990875558144 | |
| Correlation | -0.0333197898093455 | |
| Determination | 0.00111020839293896 | |
| T-Test | -0.333383011795298 | |
| p-value (2 sided) | 0.739543192760911 | |
| p-value (1 sided) | 0.369771596380455 | |
| 95% CI of Correlation | [-0.226328111613072, 0.162206180859003] | |
| Degrees of Freedom | 100 | |
| Number of Observations | 102 | |
| Normality Tests |
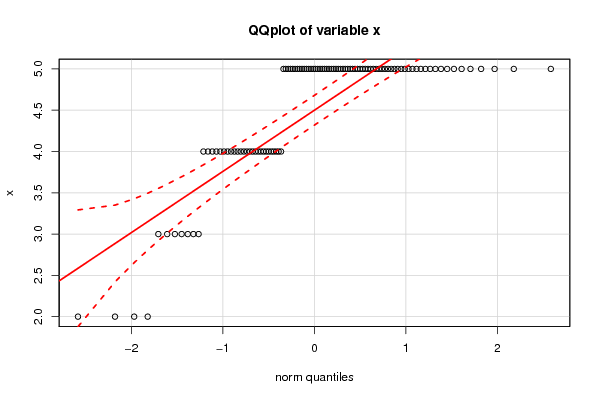
> jarque.x Jarque-Bera Normality Test data: x JB = 58.275, p-value = 2.217e-13 alternative hypothesis: greater |
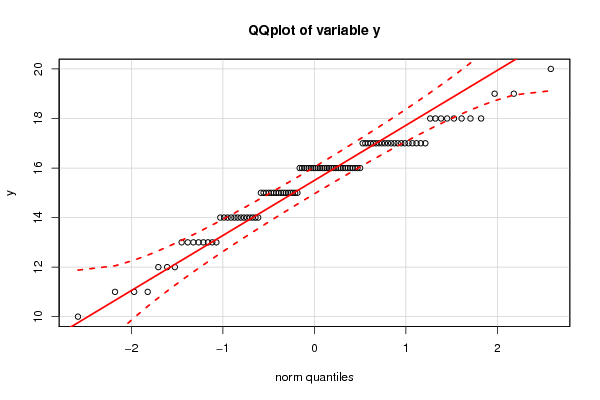
> jarque.y Jarque-Bera Normality Test data: y JB = 4.7984, p-value = 0.09079 alternative hypothesis: greater |
> ad.x Anderson-Darling normality test data: x A = 14.103, p-value < 2.2e-16 |
> ad.y Anderson-Darling normality test data: y A = 1.9821, p-value = 4.39e-05 |