| Pearson Product Moment Correlation - Ungrouped Data | ||
| Statistic | Variable X | Variable Y |
| Mean | 14.0119760479042 | 14.622754491018 |
| Biased Variance | 4.37111405930654 | 4.8337337301445 |
| Biased Standard Deviation | 2.09072094247571 | 2.19857538650475 |
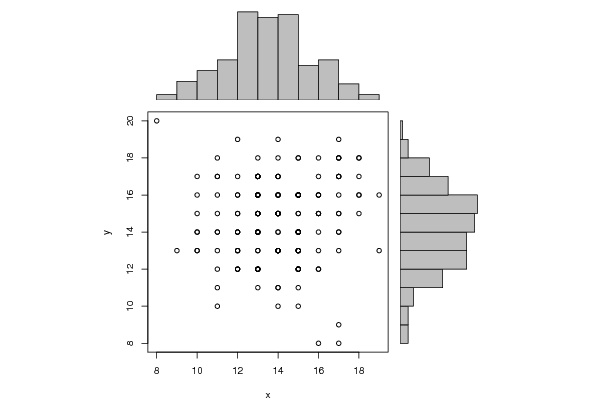
| Covariance | 0.263581271192555 | |
| Correlation | 0.0569991965355576 | |
| Determination | 0.00324890840569912 | |
| T-Test | 0.733360215570047 | |
| p-value (2 sided) | 0.464379430014033 | |
| p-value (1 sided) | 0.232189715007017 | |
| 95% CI of Correlation | [-0.0956927241945763, 0.207070368784929] | |
| Degrees of Freedom | 165 | |
| Number of Observations | 167 | |
| Normality Tests |
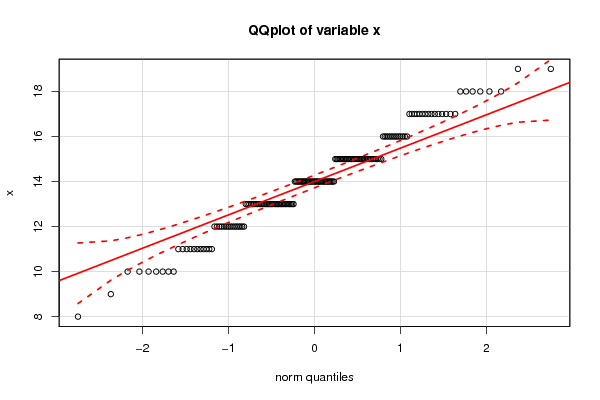
> jarque.x Jarque-Bera Normality Test data: x JB = 0.23613, p-value = 0.8886 alternative hypothesis: greater |
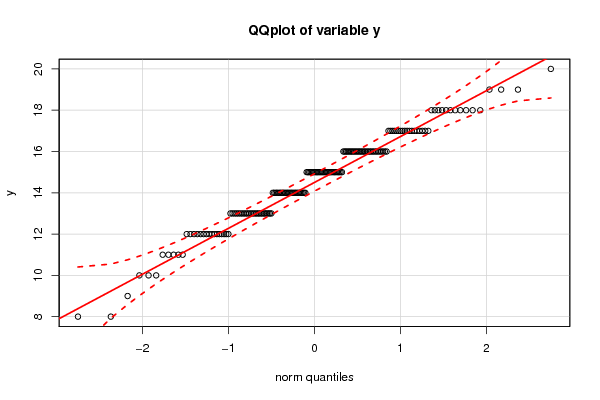
> jarque.y Jarque-Bera Normality Test data: y JB = 2.677, p-value = 0.2622 alternative hypothesis: greater |
> ad.x Anderson-Darling normality test data: x A = 1.7766, p-value = 0.0001454 |
> ad.y Anderson-Darling normality test data: y A = 1.6297, p-value = 0.0003344 |