| Tabulation of Results | ||||
| TVDC3 x ITH3 | ||||
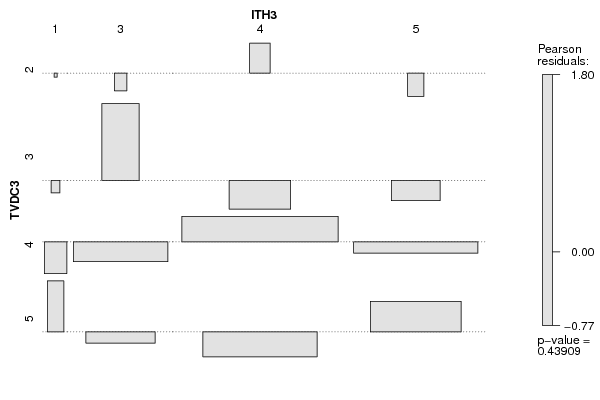
| 1 | 3 | 4 | 5 | 2 | 0 | 0 | 1 | 0 | 3 | 0 | 4 | 3 | 2 | 4 | 0 | 9 | 32 | 17 | 5 | 1 | 5 | 13 | 12 |
| Tabulation of Expected Results | ||||
| TVDC3 x ITH3 | ||||
| 1 | 3 | 4 | 5 | 2 | 0.01 | 0.18 | 0.49 | 0.31 | 3 | 0.09 | 1.64 | 4.45 | 2.82 | 4 | 0.59 | 10.55 | 28.71 | 18.16 | 5 | 0.31 | 5.64 | 15.34 | 9.71 |
| Statistical Results | |
| Pearson's Chi-squared test with simulated p-value (based on 2000 replicates) | |
| Exact Pearson Chi Square Statistic | 8.98 |
| P value | 0.33 |