| Tabulation of Results | |||||
| SN1 x SN2 | |||||
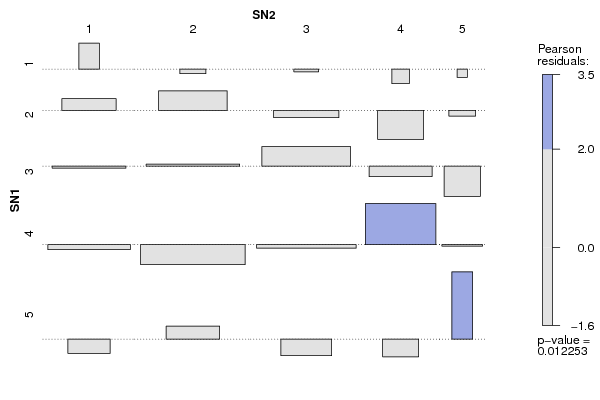
| 1 | 2 | 3 | 4 | 5 | 1 | 2 | 1 | 1 | 0 | 0 | 2 | 7 | 12 | 7 | 1 | 1 | 3 | 10 | 17 | 19 | 6 | 0 | 4 | 12 | 16 | 18 | 16 | 3 | 5 | 2 | 7 | 3 | 1 | 4 |
| Tabulation of Expected Results | |||||
| SN1 x SN2 | |||||
| 1 | 2 | 3 | 4 | 5 | 1 | 0.8 | 1.28 | 1.16 | 0.58 | 0.19 | 2 | 5.57 | 8.94 | 8.1 | 4.05 | 1.35 | 3 | 10.34 | 16.6 | 15.04 | 7.52 | 2.51 | 4 | 12.92 | 20.75 | 18.8 | 9.4 | 3.13 | 5 | 3.38 | 5.43 | 4.92 | 2.46 | 0.82 |
| Statistical Results | |
| Pearson's Chi-squared test | |
| Pearson Chi Square Statistic | 31.32 |
| Degrees of Freedom | 16 |
| P value | 0.01 |