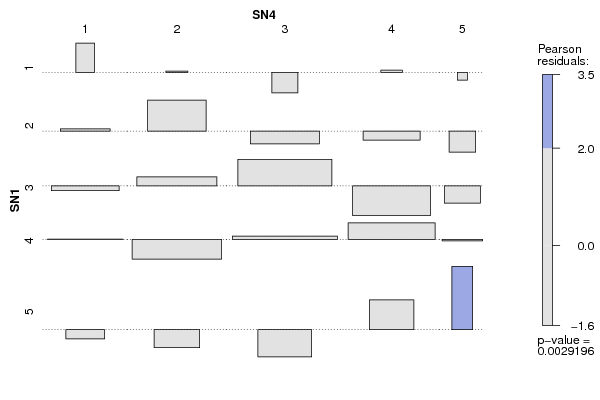
| Tabulation of Results | |||||
| SN1 x SN4 | |||||
| 1 | 2 | 3 | 4 | 5 | 1 | 2 | 1 | 0 | 1 | 0 | 2 | 5 | 11 | 7 | 5 | 0 | 3 | 8 | 14 | 23 | 6 | 1 | 4 | 11 | 11 | 22 | 18 | 3 | 5 | 2 | 2 | 2 | 7 | 4 |
| Tabulation of Expected Results | |||||
| SN1 x SN4 | |||||
| 1 | 2 | 3 | 4 | 5 | 1 | 0.67 | 0.94 | 1.3 | 0.89 | 0.19 | 2 | 4.72 | 6.58 | 9.11 | 6.24 | 1.35 | 3 | 8.77 | 12.22 | 16.92 | 11.59 | 2.51 | 4 | 10.96 | 15.27 | 21.14 | 14.49 | 3.13 | 5 | 2.87 | 3.99 | 5.53 | 3.79 | 0.82 |
| Statistical Results | |
| Pearson's Chi-squared test | |
| Pearson Chi Square Statistic | 35.97 |
| Degrees of Freedom | 16 |
| P value | 0 |