| Tabulation of Results | ||||
| Gender x ITH3 | ||||
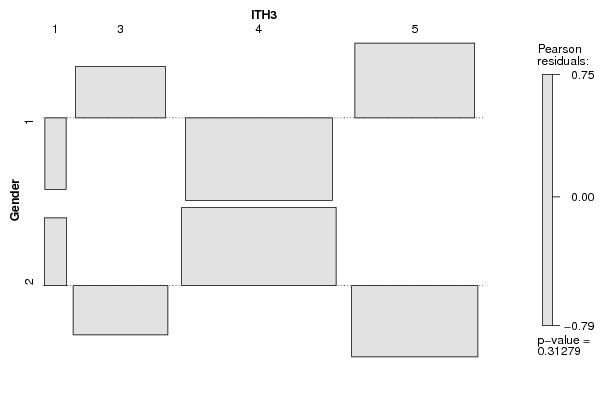
| 1 | 3 | 4 | 5 | 1 | 0 | 10 | 19 | 18 | 2 | 1 | 8 | 29 | 14 |
| Tabulation of Expected Results | ||||
| Gender x ITH3 | ||||
| 1 | 3 | 4 | 5 | 1 | 0.47 | 8.55 | 22.79 | 15.19 | 2 | 0.53 | 9.45 | 25.21 | 16.81 |
| Statistical Results | |
| Pearson's Chi-squared test | |
| Pearson Chi Square Statistic | 3.56 |
| Degrees of Freedom | 3 |
| P value | 0.31 |