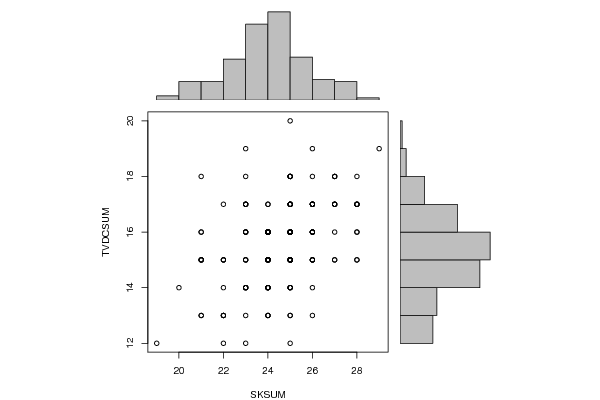
| Pearson Product Moment Correlation - Ungrouped Data | ||
| Statistic | Variable X | Variable Y |
| Mean | 24.5093167701863 | 15.6149068322981 |
| Biased Variance | 3.24370201766907 | 2.34859766212723 |
| Biased Standard Deviation | 1.80102804466479 | 1.53251351123807 |
| Covariance | 1.1286102484472 | |
| Correlation | 0.406362205380078 | |
| Determination | 0.16513024196136 | |
| T-Test | 5.60792899256869 | |
| p-value (2 sided) | 8.86378869837291e-08 | |
| p-value (1 sided) | 4.43189434918645e-08 | |
| 95% CI of Correlation | [0.268567926035735, 0.527858999994743] | |
| Degrees of Freedom | 159 | |
| Number of Observations | 161 | |
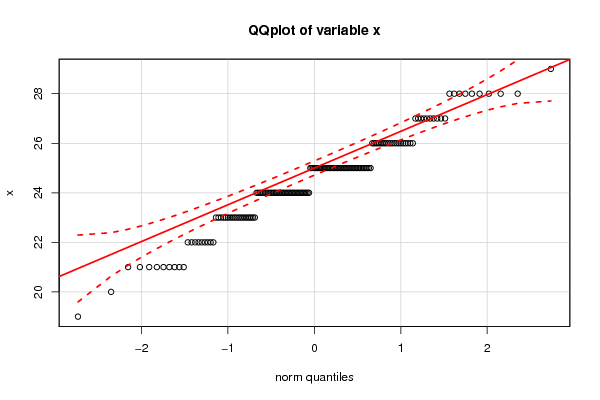
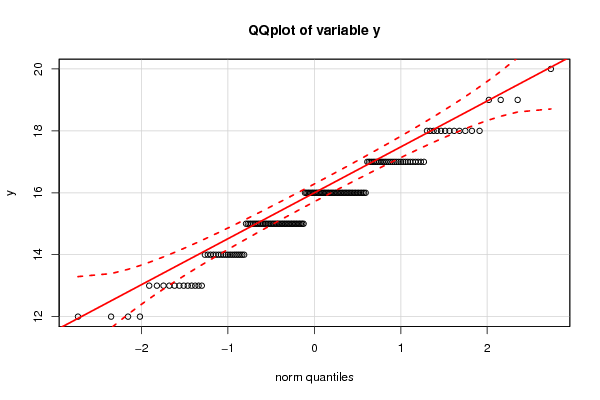
| Normality Tests |
> jarque.x Jarque-Bera Normality Test data: x JB = 1.0202, p-value = 0.6004 alternative hypothesis: greater |
> jarque.y Jarque-Bera Normality Test data: y JB = 0.19491, p-value = 0.9071 alternative hypothesis: greater |
> ad.x Anderson-Darling normality test data: x A = 2.6582, p-value = 9.94e-07 |
> ad.y Anderson-Darling normality test data: y A = 2.99, p-value = 1.535e-07 |