| Tabulation of Results | ||||
| Q2 x Q9 | ||||
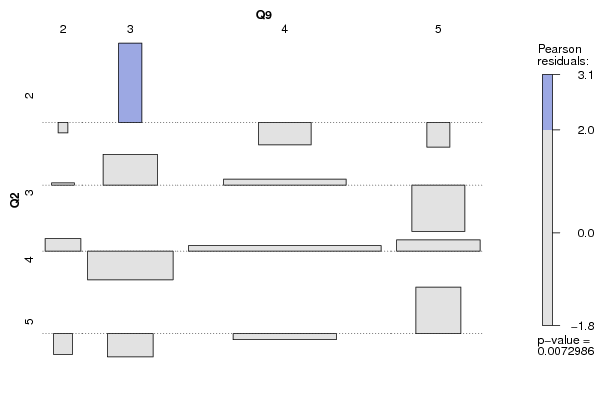
| 2 | 3 | 4 | 5 | 2 | 0 | 4 | 3 | 0 | 3 | 1 | 8 | 28 | 1 | 4 | 3 | 9 | 68 | 14 | 5 | 0 | 2 | 18 | 7 |
| Tabulation of Expected Results | ||||
| Q2 x Q9 | ||||
| 2 | 3 | 4 | 5 | 2 | 0.17 | 0.97 | 4.93 | 0.93 | 3 | 0.92 | 5.27 | 26.78 | 5.04 | 4 | 2.27 | 13.02 | 66.25 | 12.46 | 5 | 0.65 | 3.74 | 19.03 | 3.58 |
| Statistical Results | |
| Pearson's Chi-squared test | |
| Pearson Chi Square Statistic | 22.55 |
| Degrees of Freedom | 9 |
| P value | 0.01 |