| Tabulation of Results | |||||
| Geslacht x Score | |||||
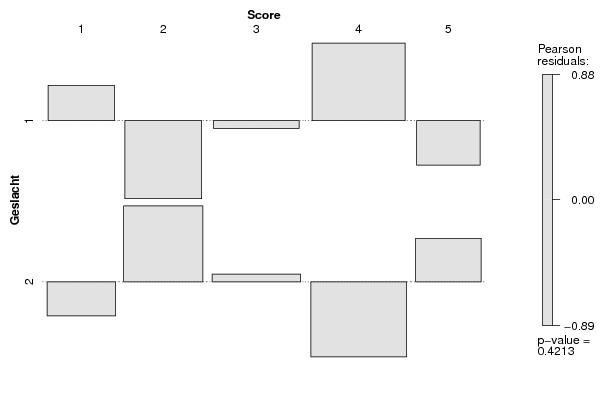
| 1 | 2 | 3 | 4 | 5 | 1 | 13 | 12 | 19 | 27 | 9 | 2 | 11 | 20 | 21 | 20 | 13 |
| Tabulation of Expected Results | |||||
| Geslacht x Score | |||||
| 1 | 2 | 3 | 4 | 5 | 1 | 11.64 | 15.52 | 19.39 | 22.79 | 10.67 | 2 | 12.36 | 16.48 | 20.61 | 24.21 | 11.33 |
| Statistical Results | |
| Pearson's Chi-squared test with simulated p-value (based on 2000 replicates) | |
| Exact Pearson Chi Square Statistic | 3.89 |
| P value | 0.44 |