| Tabulation of Results | ||||
| Geslacht x Score | ||||
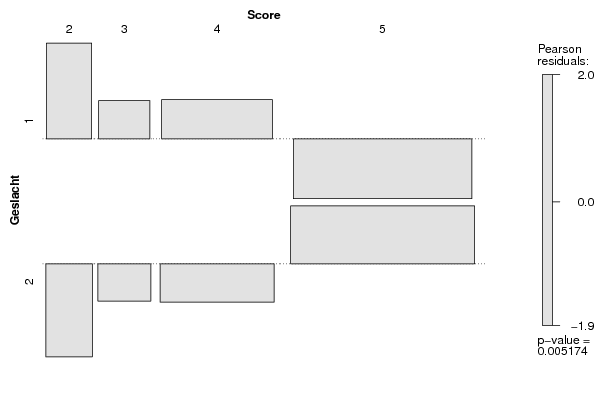
| 2 | 3 | 4 | 5 | 1 | 7 | 6 | 24 | 44 | 2 | 0 | 3 | 18 | 65 |
| Tabulation of Expected Results | ||||
| Geslacht x Score | ||||
| 2 | 3 | 4 | 5 | 1 | 3.4 | 4.37 | 20.37 | 52.87 | 2 | 3.6 | 4.63 | 21.63 | 56.13 |
| Statistical Results | |
| Pearson's Chi-squared test with simulated p-value (based on 2000 replicates) | |
| Exact Pearson Chi Square Statistic | 12.76 |
| P value | 0 |