| Pearson Product Moment Correlation - Ungrouped Data | ||
| Statistic | Variable X | Variable Y |
| Mean | 3.4203821656051 | 4.38853503184713 |
| Biased Variance | 0.434743802994036 | 0.556046898454298 |
| Biased Standard Deviation | 0.659351046858983 | 0.745685522492088 |
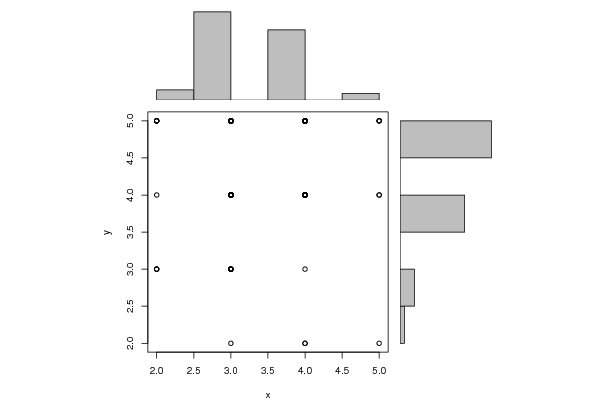
| Covariance | 0.0151069737056998 | |
| Correlation | 0.0305302252044135 | |
| Determination | 0.000932094651032205 | |
| T-Test | 0.380275506198755 | |
| p-value (2 sided) | 0.704261517768259 | |
| p-value (1 sided) | 0.352130758884129 | |
| 95% CI of Correlation | [-0.126713883140137, 0.186277546680097] | |
| Degrees of Freedom | 155 | |
| Number of Observations | 157 | |
| Normality Tests |
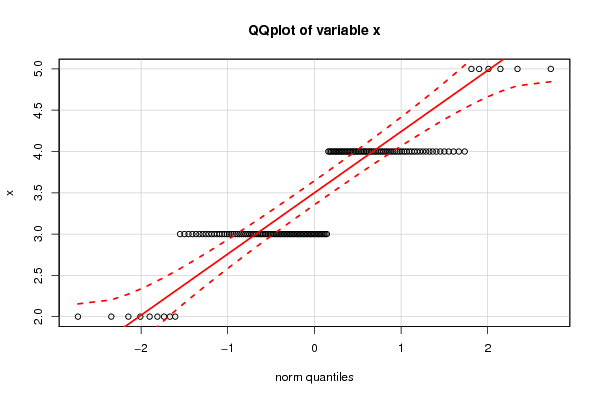
> jarque.x Jarque-Bera Normality Test data: x JB = 0.45515, p-value = 0.7965 alternative hypothesis: greater |
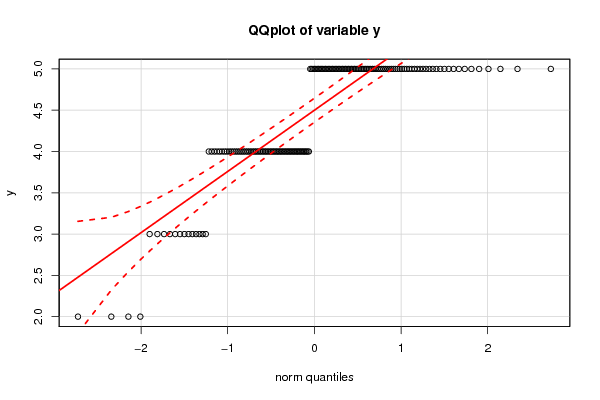
> jarque.y Jarque-Bera Normality Test data: y JB = 39.572, p-value = 2.553e-09 alternative hypothesis: greater |
> ad.x Anderson-Darling normality test data: x A = 15.312, p-value < 2.2e-16 |
> ad.y Anderson-Darling normality test data: y A = 16.274, p-value < 2.2e-16 |