| Multiple Linear Regression - Estimated Regression Equation |
| TVDCSUM[t] = + 14.2885 + 0.126562KVDD1[t] -0.0102548KVDD2[t] -0.0640709KVDD3[t] + 0.212575KVDD4[t] + e[t] |
| Multiple Linear Regression - Ordinary Least Squares | |||||
| Variable | Parameter | S.D. | T-STAT H0: parameter = 0 | 2-tail p-value | 1-tail p-value |
| (Intercept) | +14.29 | 1.461 | +9.7800e+00 | 9.112e-16 | 4.556e-16 |
| KVDD1 | +0.1266 | 0.2696 | +4.6950e-01 | 0.6399 | 0.3199 |
| KVDD2 | -0.01026 | 0.2021 | -5.0750e-02 | 0.9596 | 0.4798 |
| KVDD3 | -0.06407 | 0.2193 | -2.9210e-01 | 0.7709 | 0.3854 |
| KVDD4 | +0.2126 | 0.2296 | +9.2590e-01 | 0.357 | 0.1785 |
| Multiple Linear Regression - Regression Statistics | |
| Multiple R | 0.1177 |
| R-squared | 0.01386 |
| Adjusted R-squared | -0.03046 |
| F-TEST (value) | 0.3128 |
| F-TEST (DF numerator) | 4 |
| F-TEST (DF denominator) | 89 |
| p-value | 0.8687 |
| Multiple Linear Regression - Residual Statistics | |
| Residual Standard Deviation | 1.953 |
| Sum Squared Residuals | 339.4 |
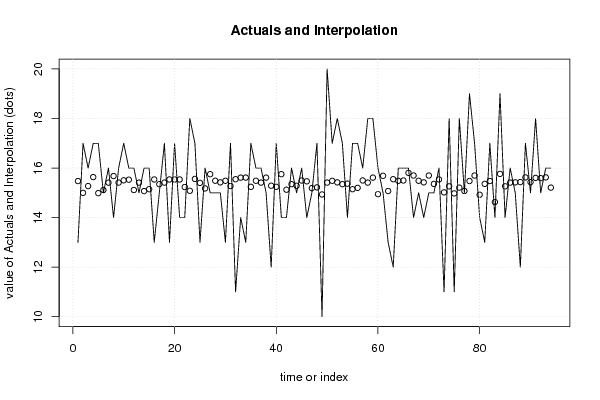
| Multiple Linear Regression - Actuals, Interpolation, and Residuals | |||
| Time or Index | Actuals | Interpolation Forecast | Residuals Prediction Error |
| 1 | 13 | 15.47 | -2.474 |
| 2 | 17 | 15 | 2.003 |
| 3 | 16 | 15.27 | 0.728 |
| 4 | 17 | 15.63 | 1.367 |
| 5 | 17 | 14.99 | 2.013 |
| 6 | 15 | 15.11 | -0.1132 |
| 7 | 16 | 15.41 | 0.5898 |
| 8 | 14 | 15.68 | -1.677 |
| 9 | 16 | 15.41 | 0.5882 |
| 10 | 17 | 15.51 | 1.495 |
| 11 | 16 | 15.53 | 0.4714 |
| 12 | 16 | 15.11 | 0.8868 |
| 13 | 15 | 15.41 | -0.4118 |
| 14 | 16 | 15.07 | 0.9303 |
| 15 | 16 | 15.15 | 0.8546 |
| 16 | 13 | 15.54 | -2.538 |
| 17 | 15 | 15.35 | -0.3478 |
| 18 | 17 | 15.41 | 1.588 |
| 19 | 13 | 15.54 | -2.538 |
| 20 | 17 | 15.54 | 1.462 |
| 21 | 14 | 15.54 | -1.538 |
| 22 | 14 | 15.23 | -1.233 |
| 23 | 18 | 15.08 | 2.919 |
| 24 | 17 | 15.56 | 1.44 |
| 25 | 13 | 15.4 | -2.4 |
| 26 | 16 | 15.18 | 0.8227 |
| 27 | 15 | 15.75 | -0.751 |
| 28 | 15 | 15.49 | -0.4862 |
| 29 | 15 | 15.42 | -0.4205 |
| 30 | 13 | 15.48 | -2.485 |
| 31 | 17 | 15.27 | 1.726 |
| 32 | 11 | 15.55 | -4.549 |
| 33 | 14 | 15.61 | -1.613 |
| 34 | 13 | 15.61 | -2.614 |
| 35 | 17 | 15.24 | 1.759 |
| 36 | 16 | 15.48 | 0.5153 |
| 37 | 16 | 15.41 | 0.5882 |
| 38 | 15 | 15.61 | -0.6127 |
| 39 | 12 | 15.29 | -3.285 |
| 40 | 17 | 15.24 | 1.758 |
| 41 | 14 | 15.75 | -1.751 |
| 42 | 14 | 15.12 | -1.125 |
| 43 | 16 | 15.35 | 0.6522 |
| 44 | 15 | 15.28 | -0.2837 |
| 45 | 16 | 15.5 | 0.5036 |
| 46 | 14 | 15.46 | -1.464 |
| 47 | 15 | 15.19 | -0.189 |
| 48 | 17 | 15.22 | 1.78 |
| 49 | 10 | 14.93 | -4.933 |
| 50 | 20 | 15.41 | 4.588 |
| 51 | 17 | 15.48 | 1.515 |
| 52 | 18 | 15.42 | 2.578 |
| 53 | 17 | 15.35 | 1.652 |
| 54 | 14 | 15.37 | -1.368 |
| 55 | 17 | 15.15 | 1.855 |
| 56 | 17 | 15.2 | 1.801 |
| 57 | 16 | 15.5 | 0.5022 |
| 58 | 18 | 15.41 | 2.588 |
| 59 | 18 | 15.61 | 2.387 |
| 60 | 16 | 14.95 | 1.054 |
| 61 | 15 | 15.69 | -0.6869 |
| 62 | 13 | 15.07 | -2.071 |
| 63 | 12 | 15.55 | -3.549 |
| 64 | 16 | 15.48 | 0.5154 |
| 65 | 16 | 15.5 | 0.5036 |
| 66 | 16 | 15.8 | 0.1952 |
| 67 | 14 | 15.7 | -1.699 |
| 68 | 15 | 15.49 | -0.4862 |
| 69 | 14 | 15.42 | -1.422 |
| 70 | 15 | 15.7 | -0.6971 |
| 71 | 15 | 15.36 | -0.358 |
| 72 | 16 | 15.54 | 0.4616 |
| 73 | 11 | 15.02 | -4.017 |
| 74 | 18 | 15.26 | 2.738 |
| 75 | 11 | 14.98 | -3.976 |
| 76 | 18 | 15.21 | 2.791 |
| 77 | 15 | 15.07 | -0.07269 |
| 78 | 19 | 15.48 | 3.524 |
| 79 | 17 | 15.7 | 1.303 |
| 80 | 14 | 14.92 | -0.9226 |
| 81 | 13 | 15.36 | -2.36 |
| 82 | 17 | 15.48 | 1.524 |
| 83 | 14 | 14.63 | -0.6275 |
| 84 | 19 | 15.76 | 3.239 |
| 85 | 14 | 15.26 | -1.263 |
| 86 | 16 | 15.41 | 0.5882 |
| 87 | 15 | 15.42 | -0.4221 |
| 88 | 12 | 15.43 | -3.432 |
| 89 | 17 | 15.62 | 1.377 |
| 90 | 15 | 15.43 | -0.4308 |
| 91 | 18 | 15.6 | 2.398 |
| 92 | 15 | 15.59 | -0.5911 |
| 93 | 16 | 15.62 | 0.3772 |
| 94 | 16 | 15.21 | 0.7905 |
| Goldfeld-Quandt test for Heteroskedasticity | |||
| p-values | Alternative Hypothesis | ||
| breakpoint index | greater | 2-sided | less |
| 8 | 0.2333 | 0.4667 | 0.7667 |
| 9 | 0.1117 | 0.2234 | 0.8883 |
| 10 | 0.05294 | 0.1059 | 0.9471 |
| 11 | 0.07394 | 0.1479 | 0.9261 |
| 12 | 0.03616 | 0.07232 | 0.9638 |
| 13 | 0.01664 | 0.03328 | 0.9834 |
| 14 | 0.01172 | 0.02345 | 0.9883 |
| 15 | 0.00529 | 0.01058 | 0.9947 |
| 16 | 0.008432 | 0.01686 | 0.9916 |
| 17 | 0.003945 | 0.007891 | 0.9961 |
| 18 | 0.00617 | 0.01234 | 0.9938 |
| 19 | 0.007077 | 0.01415 | 0.9929 |
| 20 | 0.01641 | 0.03282 | 0.9836 |
| 21 | 0.0108 | 0.02161 | 0.9892 |
| 22 | 0.01677 | 0.03354 | 0.9832 |
| 23 | 0.01779 | 0.03559 | 0.9822 |
| 24 | 0.01625 | 0.0325 | 0.9838 |
| 25 | 0.02823 | 0.05647 | 0.9718 |
| 26 | 0.01988 | 0.03977 | 0.9801 |
| 27 | 0.01421 | 0.02841 | 0.9858 |
| 28 | 0.008766 | 0.01753 | 0.9912 |
| 29 | 0.005845 | 0.01169 | 0.9942 |
| 30 | 0.009954 | 0.01991 | 0.99 |
| 31 | 0.008223 | 0.01645 | 0.9918 |
| 32 | 0.05697 | 0.1139 | 0.943 |
| 33 | 0.04511 | 0.09023 | 0.9549 |
| 34 | 0.04667 | 0.09334 | 0.9533 |
| 35 | 0.04662 | 0.09324 | 0.9534 |
| 36 | 0.03427 | 0.06855 | 0.9657 |
| 37 | 0.02627 | 0.05254 | 0.9737 |
| 38 | 0.01825 | 0.0365 | 0.9817 |
| 39 | 0.05413 | 0.1083 | 0.9459 |
| 40 | 0.04565 | 0.0913 | 0.9544 |
| 41 | 0.044 | 0.08801 | 0.956 |
| 42 | 0.03654 | 0.07308 | 0.9635 |
| 43 | 0.02854 | 0.05709 | 0.9715 |
| 44 | 0.02003 | 0.04005 | 0.98 |
| 45 | 0.0139 | 0.0278 | 0.9861 |
| 46 | 0.01255 | 0.02511 | 0.9874 |
| 47 | 0.008631 | 0.01726 | 0.9914 |
| 48 | 0.008793 | 0.01759 | 0.9912 |
| 49 | 0.1802 | 0.3603 | 0.8198 |
| 50 | 0.4563 | 0.9126 | 0.5437 |
| 51 | 0.4417 | 0.8835 | 0.5583 |
| 52 | 0.4974 | 0.9949 | 0.5026 |
| 53 | 0.4744 | 0.9489 | 0.5256 |
| 54 | 0.4459 | 0.8917 | 0.5541 |
| 55 | 0.4484 | 0.8969 | 0.5516 |
| 56 | 0.4368 | 0.8737 | 0.5632 |
| 57 | 0.3828 | 0.7657 | 0.6172 |
| 58 | 0.4216 | 0.8432 | 0.5784 |
| 59 | 0.4533 | 0.9066 | 0.5467 |
| 60 | 0.4148 | 0.8297 | 0.5852 |
| 61 | 0.3793 | 0.7587 | 0.6207 |
| 62 | 0.3742 | 0.7484 | 0.6258 |
| 63 | 0.5406 | 0.9188 | 0.4594 |
| 64 | 0.4766 | 0.9532 | 0.5234 |
| 65 | 0.4195 | 0.8389 | 0.5805 |
| 66 | 0.398 | 0.796 | 0.602 |
| 67 | 0.4244 | 0.8489 | 0.5756 |
| 68 | 0.3689 | 0.7378 | 0.6311 |
| 69 | 0.3471 | 0.6942 | 0.6529 |
| 70 | 0.3224 | 0.6448 | 0.6776 |
| 71 | 0.2619 | 0.5238 | 0.7381 |
| 72 | 0.2144 | 0.4287 | 0.7856 |
| 73 | 0.2969 | 0.5938 | 0.7031 |
| 74 | 0.355 | 0.71 | 0.645 |
| 75 | 0.6256 | 0.7487 | 0.3744 |
| 76 | 0.7159 | 0.5682 | 0.2841 |
| 77 | 0.6344 | 0.7312 | 0.3656 |
| 78 | 0.7238 | 0.5523 | 0.2762 |
| 79 | 0.6511 | 0.6978 | 0.3489 |
| 80 | 0.5702 | 0.8596 | 0.4298 |
| 81 | 0.6279 | 0.7441 | 0.3721 |
| 82 | 0.5245 | 0.951 | 0.4755 |
| 83 | 0.7124 | 0.5753 | 0.2876 |
| 84 | 0.6845 | 0.6309 | 0.3155 |
| 85 | 0.6459 | 0.7082 | 0.3541 |
| 86 | 0.484 | 0.9679 | 0.516 |
| Meta Analysis of Goldfeld-Quandt test for Heteroskedasticity | |||
| Description | # significant tests | % significant tests | OK/NOK |
| 1% type I error level | 1 | 0.01266 | NOK |
| 5% type I error level | 24 | 0.303797 | NOK |
| 10% type I error level | 35 | 0.443038 | NOK |
| Ramsey RESET F-Test for powers (2 and 3) of fitted values |
> reset_test_fitted RESET test data: mylm RESET = 0.89047, df1 = 2, df2 = 87, p-value = 0.4142 |
| Ramsey RESET F-Test for powers (2 and 3) of regressors |
> reset_test_regressors RESET test data: mylm RESET = 1.6314, df1 = 8, df2 = 81, p-value = 0.1287 |
| Ramsey RESET F-Test for powers (2 and 3) of principal components |
> reset_test_principal_components RESET test data: mylm RESET = 0.66387, df1 = 2, df2 = 87, p-value = 0.5174 |
| Variance Inflation Factors (Multicollinearity) |
> vif KVDD1 KVDD2 KVDD3 KVDD4 1.052731 1.032114 1.049427 1.045602 |