| Pearson Product Moment Correlation - Ungrouped Data | ||
| Statistic | Variable X | Variable Y |
| Mean | 15.53 | 16.82 |
| Biased Variance | 3.4491 | 5.1476 |
| Biased Standard Deviation | 1.85717527444235 | 2.26883229878279 |
| Covariance | 0.46 | |
| Correlation | 0.108078108933886 | |
| Determination | 0.0116808776307249 | |
| T-Test | 1.07622276874438 | |
| p-value (2 sided) | 0.284469970999508 | |
| p-value (1 sided) | 0.142234985499754 | |
| 95% CI of Correlation | [-0.0902560083048946, 0.298166597385177] | |
| Degrees of Freedom | 98 | |
| Number of Observations | 100 | |
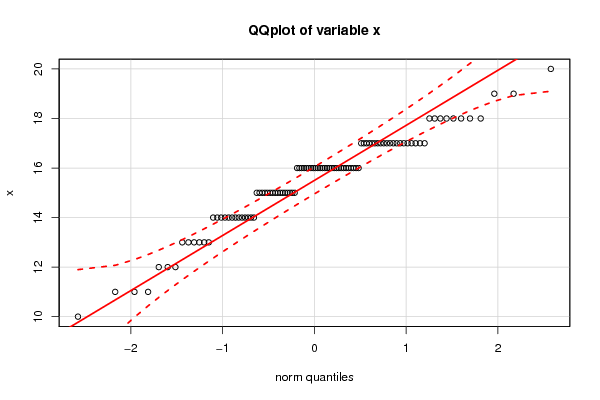
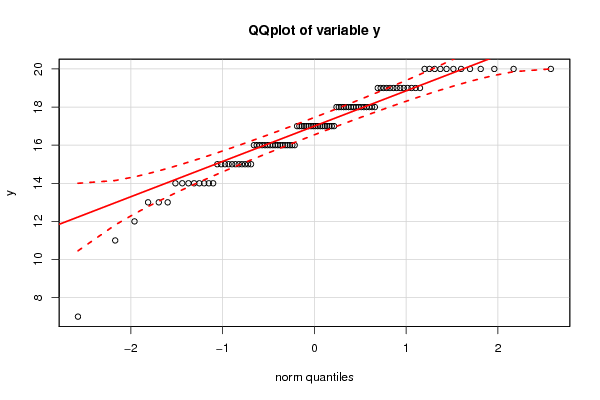
| Normality Tests |
> jarque.x Jarque-Bera Normality Test data: x JB = 6.1727, p-value = 0.04567 alternative hypothesis: greater |
> jarque.y Jarque-Bera Normality Test data: y JB = 36.033, p-value = 1.498e-08 alternative hypothesis: greater |
> ad.x Anderson-Darling normality test data: x A = 2.0631, p-value = 2.767e-05 |
> ad.y Anderson-Darling normality test data: y A = 1.3952, p-value = 0.001235 |