| Pearson Product Moment Correlation - Ungrouped Data | ||
| Statistic | Variable X | Variable Y |
| Mean | 4.73333333333333 | 1.86666666666667 |
| Biased Variance | 4.06222222222222 | 2.24888888888889 |
| Biased Standard Deviation | 2.0154955277108 | 1.4996295838936 |
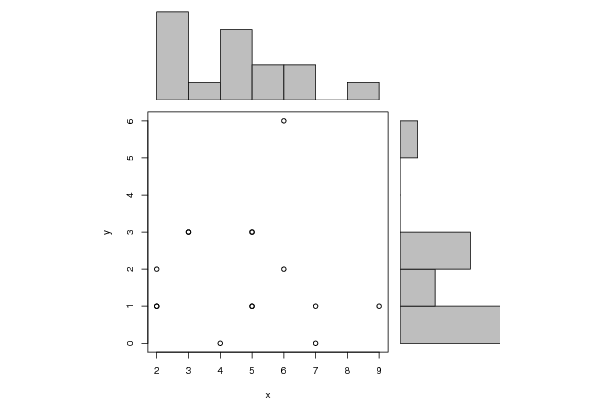
| Covariance | -0.180952380952381 | |
| Correlation | -0.0558772778133752 | |
| Determination | 0.00312227017583311 | |
| T-Test | -0.201783648095073 | |
| p-value (2 sided) | 0.843209141847811 | |
| p-value (1 sided) | 0.421604570923906 | |
| 95% CI of Correlation | [-0.552330300287432, 0.469834026337066] | |
| Degrees of Freedom | 13 | |
| Number of Observations | 15 | |
| Normality Tests |
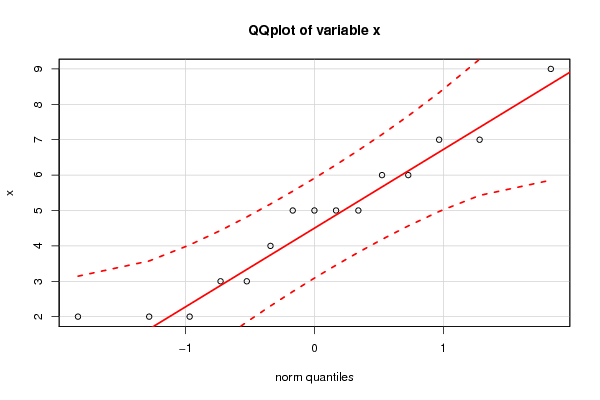
> jarque.x Jarque-Bera Normality Test data: x JB = 0.46676, p-value = 0.7919 alternative hypothesis: greater |
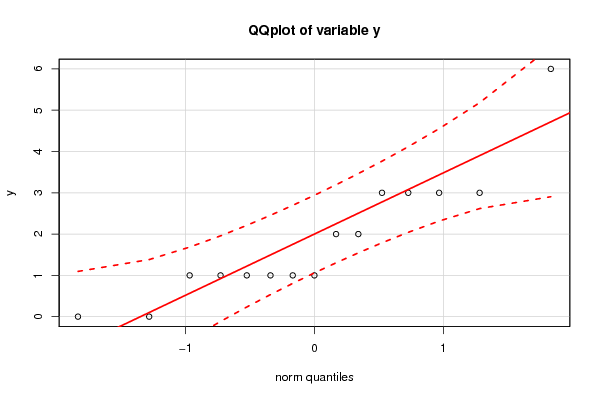
> jarque.y Jarque-Bera Normality Test data: y JB = 4.5168, p-value = 0.1045 alternative hypothesis: greater |
> ad.x Anderson-Darling normality test data: x A = 0.35485, p-value = 0.4119 |
> ad.y Anderson-Darling normality test data: y A = 0.86064, p-value = 0.02026 |