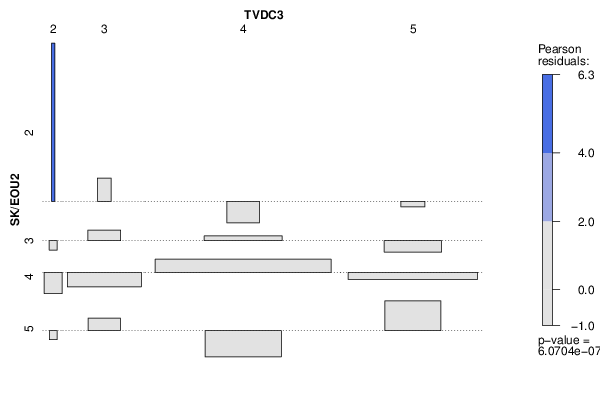
| Tabulation of Results | ||||
| SK/EOU2 x TVDC3 | ||||
| 2 | 3 | 4 | 5 | 2 | 1 | 1 | 1 | 1 | 3 | 0 | 3 | 14 | 6 | 4 | 0 | 10 | 72 | 35 | 5 | 0 | 3 | 9 | 10 |
| Tabulation of Expected Results | ||||
| SK/EOU2 x TVDC3 | ||||
| 2 | 3 | 4 | 5 | 2 | 0.02 | 0.41 | 2.31 | 1.25 | 3 | 0.14 | 2.36 | 13.3 | 7.2 | 4 | 0.7 | 11.98 | 67.66 | 36.65 | 5 | 0.13 | 2.25 | 12.72 | 6.89 |
| Statistical Results | |
| Pearson's Chi-squared test | |
| Pearson Chi Square Statistic | 45.98 |
| Degrees of Freedom | 9 |
| P value | 0 |