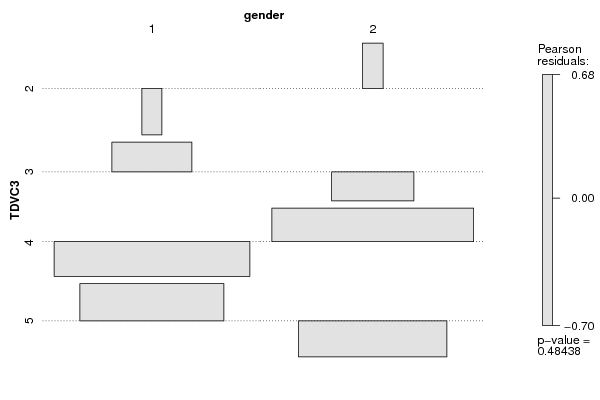
| Tabulation of Results | ||
| TDVC3 x gender | ||
| 1 | 2 | 2 | 0 | 1 | 3 | 9 | 7 | 4 | 43 | 53 | 5 | 28 | 24 |
| Tabulation of Expected Results | ||
| TDVC3 x gender | ||
| 1 | 2 | 2 | 0.48 | 0.52 | 3 | 7.76 | 8.24 | 4 | 46.55 | 49.45 | 5 | 25.21 | 26.79 |
| Statistical Results | |
| Pearson's Chi-squared test | |
| Pearson Chi Square Statistic | 2.45 |
| Degrees of Freedom | 3 |
| P value | 0.48 |