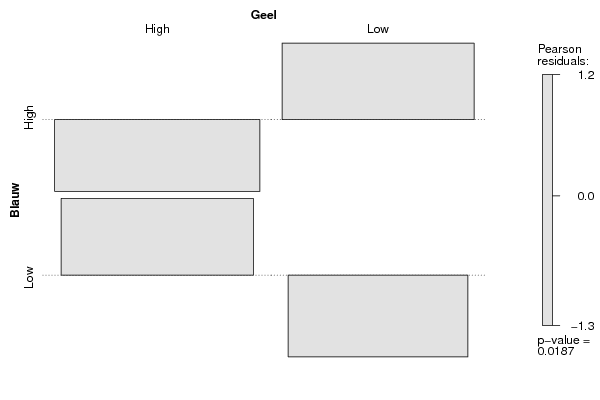
| Tabulation of Results | ||
| Blauw x Geel | ||
| High | Low | High | 2 | 6 | Low | 6 | 1 |
| Tabulation of Expected Results | ||
| Blauw x Geel | ||
| High | Low | High | 4.27 | 3.73 | Low | 3.73 | 3.27 |
| Statistical Results | |
| Pearson's Chi-squared test with simulated p-value (based on 2000 replicates) | |
| Exact Pearson Chi Square Statistic | 5.53 |
| P value | 0.03 |