| Pearson Product Moment Correlation - Ungrouped Data | ||
| Statistic | Variable X | Variable Y |
| Mean | 13.5333333333333 | 5.8 |
| Biased Variance | 2.38222222222222 | 2.96 |
| Biased Standard Deviation | 1.54344492037203 | 1.72046505340853 |
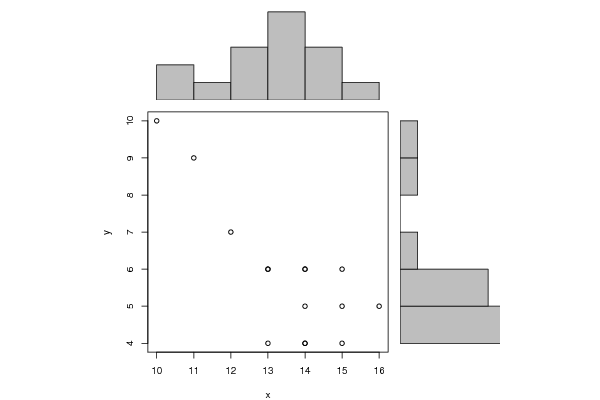
| Covariance | -2.24285714285714 | |
| Correlation | -0.788317917574515 | |
| Determination | 0.62144513916902 | |
| T-Test | -4.61964560774152 | |
| p-value (2 sided) | 0.000480246303601158 | |
| p-value (1 sided) | 0.000240123151800579 | |
| 95% CI of Correlation | [-0.926454404988244, -0.463044452846662] | |
| Degrees of Freedom | 13 | |
| Number of Observations | 15 | |
| Normality Tests |
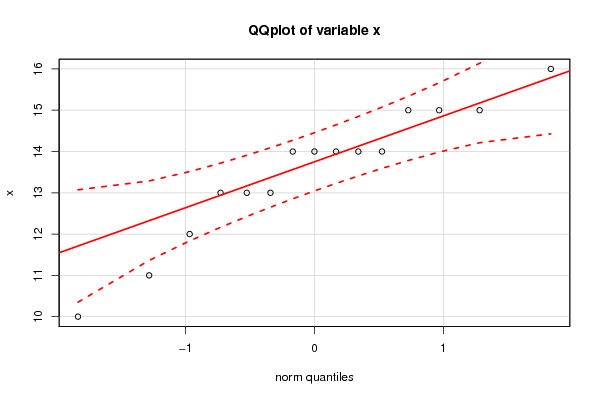
> jarque.x Jarque-Bera Normality Test data: x JB = 1.2792, p-value = 0.5275 alternative hypothesis: greater |
> jarque.y Jarque-Bera Normality Test data: y JB = 3.1685, p-value = 0.2051 alternative hypothesis: greater |
> ad.x Anderson-Darling normality test data: x A = 0.52873, p-value = 0.1475 |
> ad.y Anderson-Darling normality test data: y A = 0.85718, p-value = 0.02069 |