| Tabulation of Results | |||||
| KVDD3 x TVDC1 | |||||
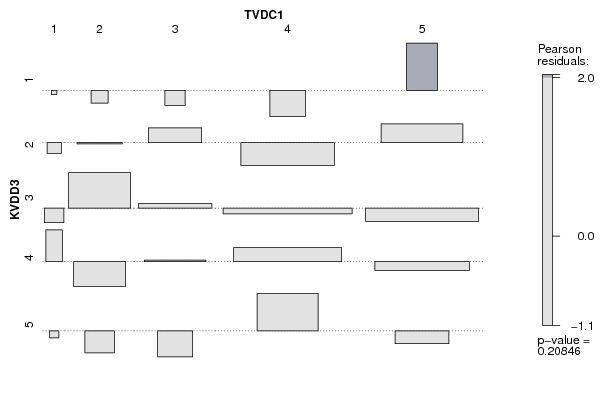
| 1 | 2 | 3 | 4 | 5 | 1 | 0 | 0 | 0 | 0 | 3 | 2 | 0 | 2 | 4 | 6 | 9 | 3 | 0 | 7 | 6 | 16 | 11 | 4 | 1 | 1 | 4 | 14 | 8 | 5 | 0 | 0 | 0 | 7 | 2 |
| Tabulation of Expected Results | |||||
| KVDD3 x TVDC1 | |||||
| 1 | 2 | 3 | 4 | 5 | 1 | 0.03 | 0.3 | 0.42 | 1.28 | 0.98 | 2 | 0.21 | 2.08 | 2.91 | 8.94 | 6.86 | 3 | 0.4 | 3.96 | 5.54 | 17.03 | 13.07 | 4 | 0.28 | 2.77 | 3.88 | 11.92 | 9.15 | 5 | 0.09 | 0.89 | 1.25 | 3.83 | 2.94 |
| Statistical Results | |
| Pearson's Chi-squared test with simulated p-value (based on 2000 replicates) | |
| Exact Pearson Chi Square Statistic | 20.27 |
| P value | 0.18 |