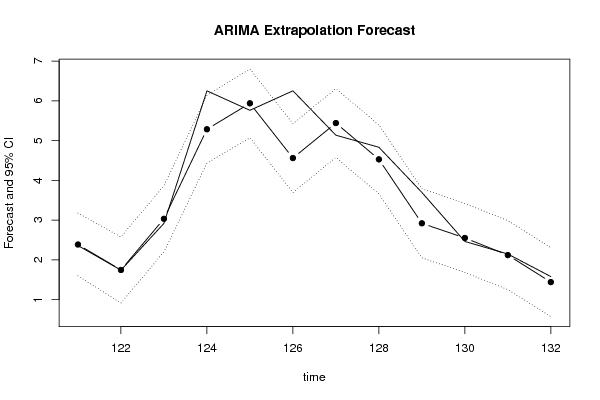
| Univariate ARIMA Extrapolation Forecast | ||||||||
| time | Y[t] | F[t] | 95% LB | 95% UB | p-value (H0: Y[t] = F[t]) | P(F[t]>Y[t-1]) | P(F[t]>Y[t-s]) | P(F[t]>Y[120]) |
| 108 | 1.169 | - | - | - | - | - | - | - |
| 109 | 2.429 | - | - | - | - | - | - | - |
| 110 | 1.762 | - | - | - | - | - | - | - |
| 111 | 2.846 | - | - | - | - | - | - | - |
| 112 | 5.627 | - | - | - | - | - | - | - |
| 113 | 5.749 | - | - | - | - | - | - | - |
| 114 | 4.502 | - | - | - | - | - | - | - |
| 115 | 5.72 | - | - | - | - | - | - | - |
| 116 | 4.403 | - | - | - | - | - | - | - |
| 117 | 2.867 | - | - | - | - | - | - | - |
| 118 | 2.635 | - | - | - | - | - | - | - |
| 119 | 2.059 | - | - | - | - | - | - | - |
| 120 | 1.511 | - | - | - | - | - | - | - |
| 121 | 2.359 | 2.3848 | 1.5962 | 3.1734 | 0.4744 | 0.9851 | 0.4563 | 0.9851 |
| 122 | 1.741 | 1.7452 | 0.9151 | 2.5753 | 0.496 | 0.0736 | 0.4842 | 0.7099 |
| 123 | 2.917 | 3.0319 | 2.2 | 3.8638 | 0.3933 | 0.9988 | 0.6693 | 0.9998 |
| 124 | 6.249 | 5.2834 | 4.4292 | 6.1376 | 0.0134 | 1 | 0.2152 | 1 |
| 125 | 5.76 | 5.9359 | 5.0716 | 6.8002 | 0.345 | 0.2389 | 0.6642 | 1 |
| 126 | 6.25 | 4.5596 | 3.6938 | 5.4254 | 1e-04 | 0.0033 | 0.5518 | 1 |
| 127 | 5.134 | 5.4399 | 4.5733 | 6.3065 | 0.2445 | 0.0335 | 0.2632 | 1 |
| 128 | 4.831 | 4.5265 | 3.6585 | 5.3944 | 0.2458 | 0.085 | 0.6098 | 1 |
| 129 | 3.695 | 2.9185 | 2.0501 | 3.7869 | 0.0398 | 0 | 0.5463 | 0.9993 |
| 130 | 2.462 | 2.5495 | 1.6811 | 3.4179 | 0.4217 | 0.0049 | 0.4235 | 0.9905 |
| 131 | 2.146 | 2.1187 | 1.2502 | 2.9872 | 0.4754 | 0.2192 | 0.5536 | 0.9149 |
| 132 | 1.579 | 1.4395 | 0.5709 | 2.3081 | 0.3765 | 0.0554 | 0.4359 | 0.4359 |
| Univariate ARIMA Extrapolation Forecast Performance | |||||||||
| time | % S.E. | PE | MAPE | sMAPE | Sq.E | MSE | RMSE | ScaledE | MASE |
| 121 | 0.1687 | -0.0109 | 0.0109 | 0.0109 | 7e-04 | 0 | 0 | -0.0263 | 0.0263 |
| 122 | 0.2427 | -0.0024 | 0.0067 | 0.0066 | 0 | 3e-04 | 0.0185 | -0.0043 | 0.0153 |
| 123 | 0.14 | -0.0394 | 0.0176 | 0.0173 | 0.0132 | 0.0046 | 0.068 | -0.1173 | 0.0493 |
| 124 | 0.0825 | 0.1545 | 0.0518 | 0.0548 | 0.9324 | 0.2366 | 0.4864 | 0.9857 | 0.2834 |
| 125 | 0.0743 | -0.0305 | 0.0476 | 0.0499 | 0.0309 | 0.1954 | 0.4421 | -0.1796 | 0.2626 |
| 126 | 0.0969 | 0.2705 | 0.0847 | 0.0937 | 2.8575 | 0.6391 | 0.7995 | 1.7256 | 0.5065 |
| 127 | 0.0813 | -0.0596 | 0.0811 | 0.0886 | 0.0936 | 0.5612 | 0.7491 | -0.3123 | 0.4787 |
| 128 | 0.0978 | 0.063 | 0.0789 | 0.0856 | 0.0927 | 0.5026 | 0.709 | 0.3109 | 0.4577 |
| 129 | 0.1518 | 0.2101 | 0.0934 | 0.1022 | 0.6029 | 0.5138 | 0.7168 | 0.7926 | 0.4949 |
| 130 | 0.1738 | -0.0356 | 0.0877 | 0.0955 | 0.0077 | 0.4632 | 0.6806 | -0.0894 | 0.4544 |
| 131 | 0.2091 | 0.0127 | 0.0808 | 0.088 | 7e-04 | 0.4211 | 0.6489 | 0.0279 | 0.4156 |
| 132 | 0.3079 | 0.0883 | 0.0815 | 0.0883 | 0.0195 | 0.3877 | 0.6226 | 0.1424 | 0.3928 |