| Pearson Product Moment Correlation - Ungrouped Data | ||
| Statistic | Variable X | Variable Y |
| Mean | 4.41818181818182 | 3.94545454545455 |
| Biased Variance | 0.679669421487603 | 0.269752066115703 |
| Biased Standard Deviation | 0.824420658091246 | 0.519376612984935 |
| Covariance | -0.0502217294900222 | |
| Correlation | -0.116578996531485 | |
| Determination | 0.0135906624322881 | |
| T-Test | -1.49859930754849 | |
| p-value (2 sided) | 0.135911785372776 | |
| p-value (1 sided) | 0.0679558926863879 | |
| 95% CI of Correlation | [-0.264648823063112, 0.0368611313066321] | |
| Degrees of Freedom | 163 | |
| Number of Observations | 165 | |
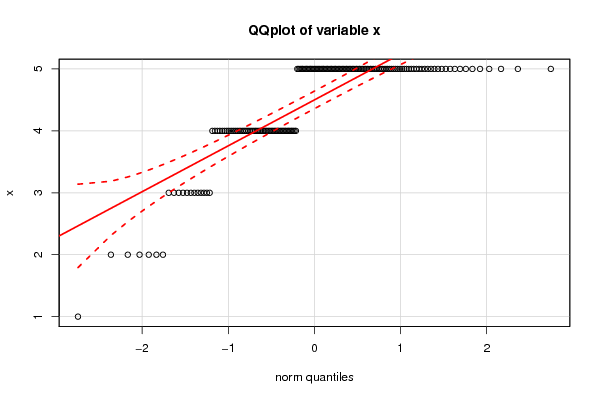
| Normality Tests |
> jarque.x Jarque-Bera Normality Test data: x JB = 102.35, p-value < 2.2e-16 alternative hypothesis: greater |
> jarque.y Jarque-Bera Normality Test data: y JB = 50.302, p-value = 1.194e-11 alternative hypothesis: greater |
> ad.x Anderson-Darling normality test data: x A = 19.26, p-value < 2.2e-16 |
> ad.y Anderson-Darling normality test data: y A = 28.565, p-value < 2.2e-16 |