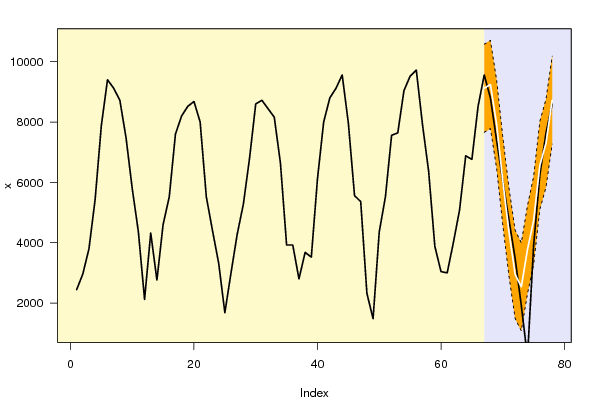
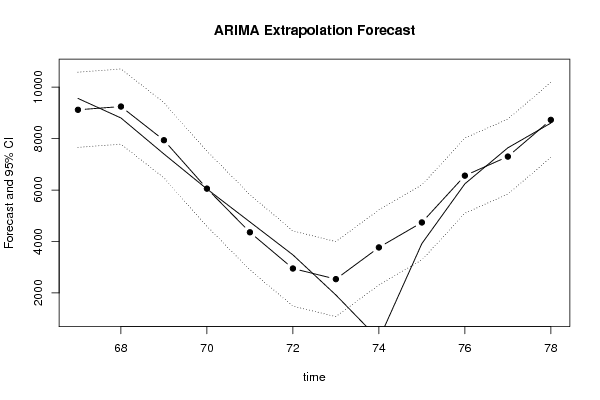
| Univariate ARIMA Extrapolation Forecast | ||||||||
| time | Y[t] | F[t] | 95% LB | 95% UB | p-value (H0: Y[t] = F[t]) | P(F[t]>Y[t-1]) | P(F[t]>Y[t-s]) | P(F[t]>Y[66]) |
| 54 | 9040 | - | - | - | - | - | - | - |
| 55 | 9520 | - | - | - | - | - | - | - |
| 56 | 9720 | - | - | - | - | - | - | - |
| 57 | 7920 | - | - | - | - | - | - | - |
| 58 | 6360 | - | - | - | - | - | - | - |
| 59 | 3880 | - | - | - | - | - | - | - |
| 60 | 3040 | - | - | - | - | - | - | - |
| 61 | 3000 | - | - | - | - | - | - | - |
| 62 | 4000 | - | - | - | - | - | - | - |
| 63 | 5080 | - | - | - | - | - | - | - |
| 64 | 6880 | - | - | - | - | - | - | - |
| 65 | 6760 | - | - | - | - | - | - | - |
| 66 | 8520 | - | - | - | - | - | - | - |
| 67 | 9560 | 9117.6892 | 7657.4201 | 10577.9582 | 0.2764 | 0.7888 | 0.2946 | 0.7888 |
| 68 | 8800 | 9243.3446 | 7782.0635 | 10704.6258 | 0.276 | 0.3355 | 0.2613 | 0.834 |
| 69 | 7400 | 7934.8796 | 6473.5971 | 9396.1622 | 0.2366 | 0.1229 | 0.508 | 0.2163 |
| 70 | 6040 | 6054.1384 | 4592.8559 | 7515.421 | 0.4924 | 0.0355 | 0.3408 | 5e-04 |
| 71 | 4760 | 4357.5188 | 2896.2363 | 5818.8014 | 0.2947 | 0.012 | 0.7391 | 0 |
| 72 | 3480 | 2950.499 | 1489.2206 | 4411.7775 | 0.2388 | 0.0076 | 0.4522 | 0 |
| 73 | 1920 | 2537.7338 | 1079.428 | 3996.0396 | 0.2032 | 0.1027 | 0.2672 | 0 |
| 74 | 200 | 3768.7859 | 2310.4801 | 5227.0918 | 0 | 0.9935 | 0.378 | 0 |
| 75 | 3920 | 4739.7828 | 3281.477 | 6198.0887 | 0.1353 | 1 | 0.3237 | 0 |
| 76 | 6240 | 6558.337 | 5100.0312 | 8016.6428 | 0.3344 | 0.9998 | 0.3328 | 0.0042 |
| 77 | 7640 | 7299.2478 | 5840.9419 | 8757.5536 | 0.3235 | 0.9227 | 0.7657 | 0.0504 |
| 78 | 8600 | 8725.8401 | 7267.5343 | 10184.1459 | 0.4328 | 0.9278 | 0.609 | 0.609 |
| Univariate ARIMA Extrapolation Forecast Performance | |||||||||
| time | % S.E. | PE | MAPE | sMAPE | Sq.E | MSE | RMSE | ScaledE | MASE |
| 67 | 0.0817 | 0.0463 | 0.0463 | 0.0474 | 195638.8594 | 0 | 0 | 0.274 | 0.274 |
| 68 | 0.0807 | -0.0504 | 0.0483 | 0.0483 | 196554.4466 | 196096.653 | 442.828 | -0.2746 | 0.2743 |
| 69 | 0.094 | -0.0723 | 0.0563 | 0.0554 | 286096.2263 | 226096.5108 | 475.4961 | -0.3313 | 0.2933 |
| 70 | 0.1231 | -0.0023 | 0.0428 | 0.0422 | 199.8954 | 169622.3569 | 411.8523 | -0.0088 | 0.2221 |
| 71 | 0.1711 | 0.0846 | 0.0512 | 0.0514 | 161991.1076 | 168096.1071 | 409.9953 | 0.2493 | 0.2276 |
| 72 | 0.2527 | 0.1522 | 0.068 | 0.0703 | 280371.2701 | 186808.6342 | 432.2136 | 0.328 | 0.2443 |
| 73 | 0.2932 | -0.3217 | 0.1042 | 0.0998 | 381595.044 | 214635.2642 | 463.2875 | -0.3826 | 0.2641 |
| 74 | 0.1974 | -17.8439 | 2.3217 | 0.3121 | 12736233.1516 | 1779835.0001 | 1334.1046 | -2.2104 | 0.5074 |
| 75 | 0.157 | -0.2091 | 2.087 | 0.2985 | 672043.9186 | 1656747.1022 | 1287.1469 | -0.5077 | 0.5074 |
| 76 | 0.1134 | -0.051 | 1.8834 | 0.2736 | 101338.4331 | 1501206.2353 | 1225.2372 | -0.1972 | 0.4764 |
| 77 | 0.1019 | 0.0446 | 1.7162 | 0.2529 | 116112.0855 | 1375288.5853 | 1172.727 | 0.2111 | 0.4523 |
| 78 | 0.0853 | -0.0146 | 1.5744 | 0.233 | 15835.7368 | 1262000.8479 | 1123.3881 | -0.0779 | 0.4211 |