| Pearson Product Moment Correlation - Ungrouped Data | ||
| Statistic | Variable X | Variable Y |
| Mean | 8.38297872340426 | 12.5212765957447 |
| Biased Variance | 2.42779538252603 | 5.73890900860118 |
| Biased Standard Deviation | 1.55813843496848 | 2.3956020138164 |
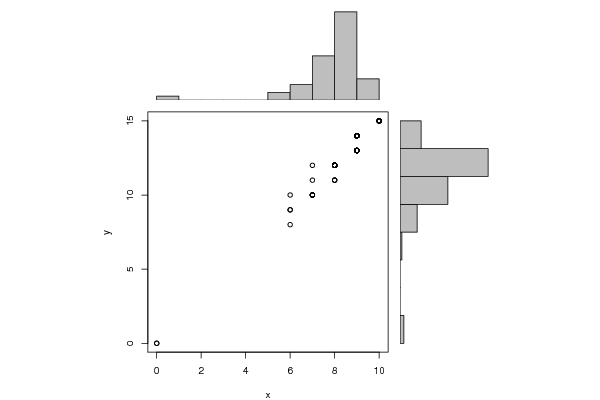
| Covariance | 3.70144131777625 | |
| Correlation | 0.981081877305373 | |
| Determination | 0.962521649977034 | |
| T-Test | 48.6081324589046 | |
| p-value (2 sided) | 2.09354522274296e-67 | |
| p-value (1 sided) | 1.04677261137148e-67 | |
| 95% CI of Correlation | [0.971604098624408, 0.987416421794941] | |
| Degrees of Freedom | 92 | |
| Number of Observations | 94 | |
| Normality Tests |
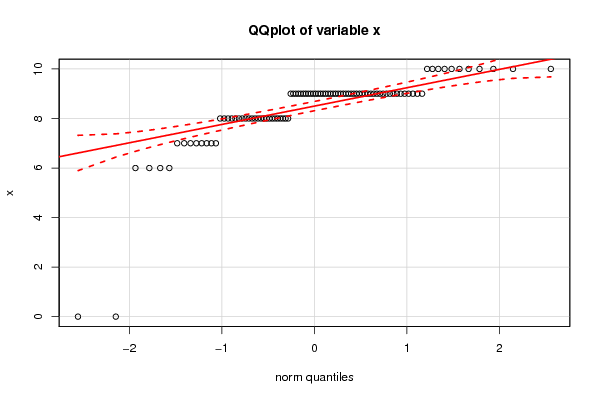
> jarque.x Jarque-Bera Normality Test data: x JB = 1089.9, p-value < 2.2e-16 alternative hypothesis: greater |
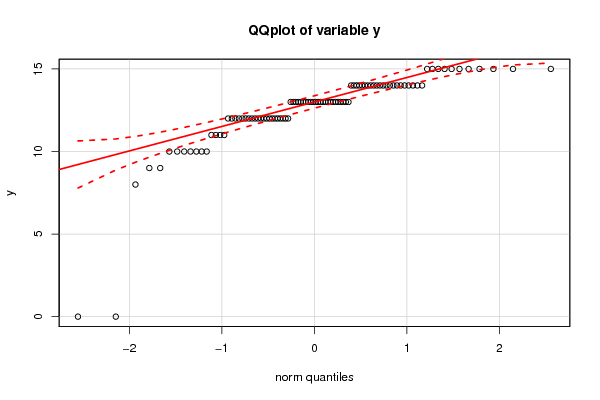
> jarque.y Jarque-Bera Normality Test data: y JB = 850.93, p-value < 2.2e-16 alternative hypothesis: greater |
> ad.x Anderson-Darling normality test data: x A = 8.7075, p-value < 2.2e-16 |
> ad.y Anderson-Darling normality test data: y A = 5.8334, p-value = 1.815e-14 |