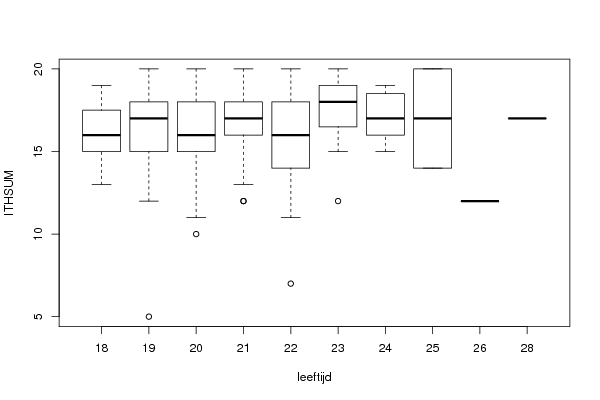
| ANOVA Model | ||||||||||
| ITHSUM ~ leeftijd | ||||||||||
| means | 16.143 | 0.151 | -0.143 | 0.502 | -0.264 | 1.383 | 0.982 | 0.857 | -4.143 | 0.857 |
| ANOVA Statistics | |||||
| Df | Sum Sq | Mean Sq | F value | Pr(>F) | |
| leeftijd | 9 | 62.953 | 6.995 | 1.127 | 0.347 |
| Residuals | 153 | 949.354 | 6.205 | ||
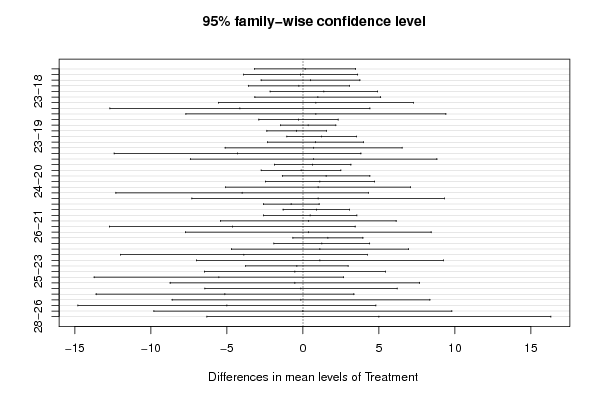
| Tukey Honest Significant Difference Comparisons | ||||
| diff | lwr | upr | p adj | |
| 19-18 | 0.151 | -3.169 | 3.471 | 1 |
| 20-18 | -0.143 | -3.893 | 3.607 | 1 |
| 21-18 | 0.502 | -2.748 | 3.751 | 1 |
| 22-18 | -0.264 | -3.592 | 3.064 | 1 |
| 23-18 | 1.383 | -2.153 | 4.92 | 0.962 |
| 24-18 | 0.982 | -3.157 | 5.122 | 0.999 |
| 25-18 | 0.857 | -5.556 | 7.27 | 1 |
| 26-18 | -4.143 | -12.694 | 4.408 | 0.867 |
| 28-18 | 0.857 | -7.694 | 9.408 | 1 |
| 20-19 | -0.294 | -2.902 | 2.314 | 1 |
| 21-19 | 0.35 | -1.467 | 2.168 | 1 |
| 22-19 | -0.415 | -2.37 | 1.539 | 1 |
| 23-19 | 1.232 | -1.059 | 3.523 | 0.778 |
| 24-19 | 0.831 | -2.312 | 3.974 | 0.998 |
| 25-19 | 0.706 | -5.114 | 6.526 | 1 |
| 26-19 | -4.294 | -12.409 | 3.821 | 0.794 |
| 28-19 | 0.706 | -7.409 | 8.821 | 1 |
| 21-20 | 0.644 | -1.874 | 3.163 | 0.998 |
| 22-20 | -0.121 | -2.74 | 2.498 | 1 |
| 23-20 | 1.526 | -1.353 | 4.405 | 0.793 |
| 24-20 | 1.125 | -2.469 | 4.719 | 0.992 |
| 25-20 | 1 | -5.075 | 7.075 | 1 |
| 26-20 | -4 | -12.3 | 4.3 | 0.871 |
| 28-20 | 1 | -7.3 | 9.3 | 1 |
| 22-21 | -0.766 | -2.599 | 1.067 | 0.942 |
| 23-21 | 0.882 | -1.306 | 3.07 | 0.954 |
| 24-21 | 0.481 | -2.588 | 3.55 | 1 |
| 25-21 | 0.356 | -5.425 | 6.136 | 1 |
| 26-21 | -4.644 | -12.731 | 3.442 | 0.706 |
| 28-21 | 0.356 | -7.731 | 8.442 | 1 |
| 23-22 | 1.648 | -0.656 | 3.951 | 0.397 |
| 24-22 | 1.246 | -1.906 | 4.398 | 0.959 |
| 25-22 | 1.121 | -4.703 | 6.946 | 1 |
| 26-22 | -3.879 | -11.998 | 4.24 | 0.876 |
| 28-22 | 1.121 | -6.998 | 9.24 | 1 |
| 24-23 | -0.401 | -3.772 | 2.97 | 1 |
| 25-23 | -0.526 | -6.472 | 5.42 | 1 |
| 26-23 | -5.526 | -13.733 | 2.68 | 0.487 |
| 28-23 | -0.526 | -8.733 | 7.68 | 1 |
| 25-24 | -0.125 | -6.448 | 6.198 | 1 |
| 26-24 | -5.125 | -13.609 | 3.359 | 0.642 |
| 28-24 | -0.125 | -8.609 | 8.359 | 1 |
| 26-25 | -5 | -14.796 | 4.796 | 0.827 |
| 28-25 | 0 | -9.796 | 9.796 | 1 |
| 28-26 | 5 | -6.311 | 16.311 | 0.919 |
| Levenes Test for Homogeneity of Variance | |||
| Df | F value | Pr(>F) | |
| Group | 9 | 1.179 | 0.312 |
| 153 | |||